Description
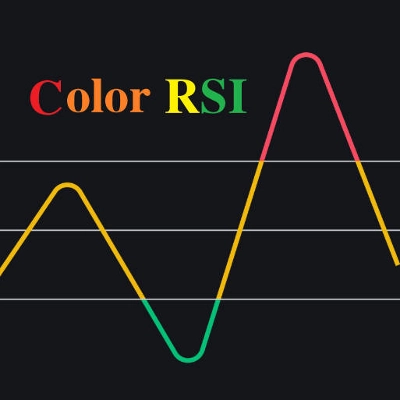
Ceci est un super indicateur qui intègre l'indicateur RSI avec un système à double moyenne mobile. L'intensité du RSI est représentée par quatre couleurs : rouge (>70) > orange (>50) > jaune (>30) > vert. Les doubles moyennes mobiles utilisent l'EMA avec des paramètres par défaut fixés à 48/144, qui peuvent être personnalisés selon vos besoins.
Comment utiliser :
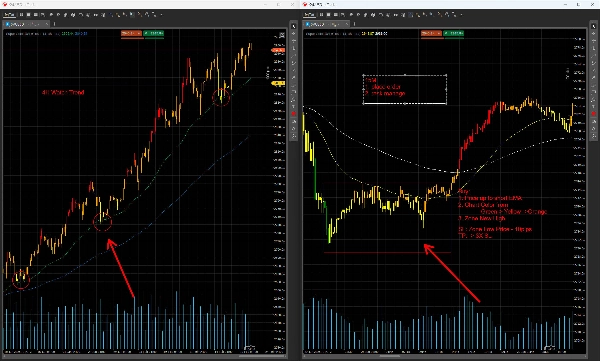
Lorsqu'il est utilisé en conjonction avec plusieurs unités de temps (par exemple, 4H→15M ; 1H→5M, illustré ici en utilisant 4H→15M comme exemple) :
- Identification de la tendance via les doubles EMA (unité de temps 4H) :
-
- Tendance haussière : 48EMA au-dessus de la 144EMA.
- Tendance baissière : 48EMA en dessous de la 144EMA.
- Consolidation en range : Les deux EMA sont emmêlées.
- Points d'entrée/sortie sur l'unité de temps 15M :
-
- Configuration d'achat (tendance haussière) :
-
- Le prix revient vers la 48EMA sur le graphique 4H.
- Passez en 15M : entrez lorsque le prix casse au-dessus de la zone de consolidation en 15M.
- Stop loss : Positionné au dernier sommet +10 pips .
- Configuration de vente (tendance baissière) :
-
- Le prix revient vers la 48EMA sur le graphique 4H.
- Passez en 15M : entrez lorsque le prix casse en dessous de la zone de consolidation en 15M.
- Stop loss : Positionné au dernier creux –10 pips .
- Signaux de divergence de prix :
-
- Divergence baissière (sommet) :
-
- Le prix fait un nouveau sommet (en repli), mais la couleur du RSI passe de rouge (RSI >70) à orange (RSI >50) .
- Divergence haussière (creux) :
-
- Le prix fait un nouveau creux (en repli), mais la couleur du RSI passe de vert (RSI ≤30) à jaune (RSI ≤50) .
Avertissement sur les risques :
Aucun indicateur ne convient à toutes les conditions de marché. Testez cette stratégie en profondeur dans un environnement de démonstration avant de l'appliquer en trading réel. Une utilisation inappropriée peut entraîner des pertes importantes.


