
说明
📌 cTrader 商店描述 – 法语 🇫🇷
🔍 指标 [LDE] OPR & 市场时段 – 清晰显示各时段!
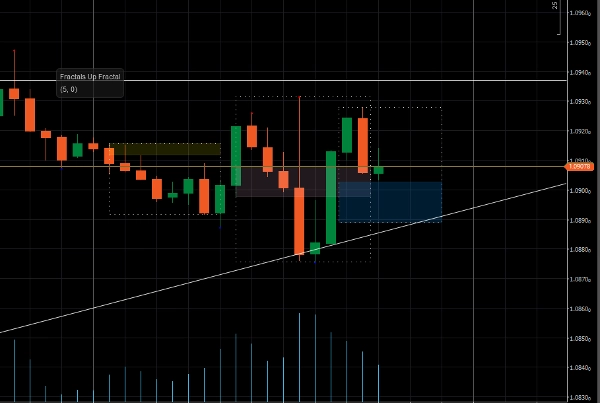
此指标突出显示 主要市场时段 (东京、伦敦、纽约),通过在您的图表上显示 动态矩形。
✔ 可自定义的时段显示 🏙️
✔ 按时段显示高点/低点 📈
✔ 突出显示开盘价区间(OPR) ⏳
✔ 可调透明度以提高可读性 🎨
✔ 兼容所有资产和时间框架 ⏰
🔧 灵活的设置:启用/禁用每个时段,调整颜色,并为每个时段个性化高点/低点显示。
🚀 通过一目了然地识别关键市场区域,优化您的交易!
📌 cTrader 商店描述 – 英语 🇬🇧
🔍 [LDE] OPR & 市场时段指标 – 清晰显示各时段!
此指标突出显示 主要市场时段(东京、伦敦、纽约),通过在您的图表上显示 动态矩形。
✔ 可自定义的时段显示 🏙️
✔ 按时段显示高点/低点 📈
✔ 突出显示开盘价区间(OPR) ⏳
✔ 可调透明度以提高可读性 🎨
✔ 兼容所有资产和时间框架 ⏰
🔧 灵活的设置:启用/禁用每个时段,调整颜色,并为每个时段个性化高点/低点显示。
🚀 通过一目了然地识别关键市场区域,优化您的交易!
摘要
AI 摘要
The LDE - Market Sessions indicator visually highlights major market sessions—Tokyo, London, and New York—by displaying dynamic rectangles on trading charts. It provides customizable session displays, allowing users to enable or disable each session and adjust colors for clarity. The indicator also visualizes session-specific high and low price levels and highlights the Open Price Range (OPR) to assist in identifying key market zones. Adjustable transparency settings improve readability, and the tool is compatible with all asset types and timeframes. Flexible parameters enable personalized visualization of session highs and lows, supporting traders in quickly recognizing important market activity periods.
指标配置
客户评价
4.0
评价:1
5 | 0 % | |
4 | 100 % | |
3 | 0 % | |
2 | 0 % | |
1 | 0 % |
客户评价
August 12, 2025
Pros: Clear visualization of trading sessions, customizable colors and times, lightweight and stable. Cons: No alerts, no volatility stats, no preset saving.
讨论
常见问答
cTrader Store 提供的所有产品,包括交易机器人、指标和插件,均由第三方开发者提供,仅供信息参考和技术访问之用。cTrader Store 并非经纪商,不提供投资建议、个人推荐或任何未来业绩保证。


价格
注册日期 28/02/2025
373
免费安装