

说明
Vice TrendTrading
“由多时间框架趋势逻辑驱动的高级趋势区域和精准入场箭头”
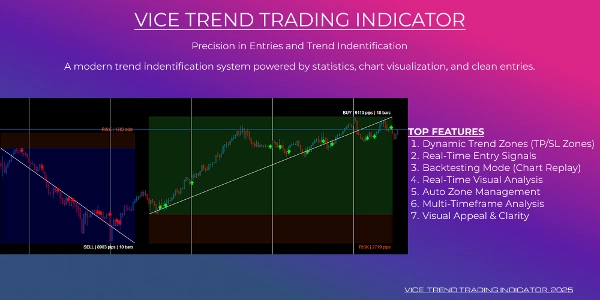
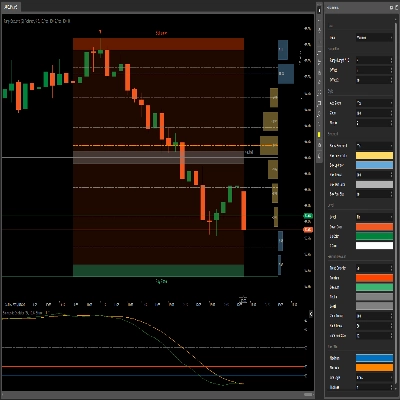
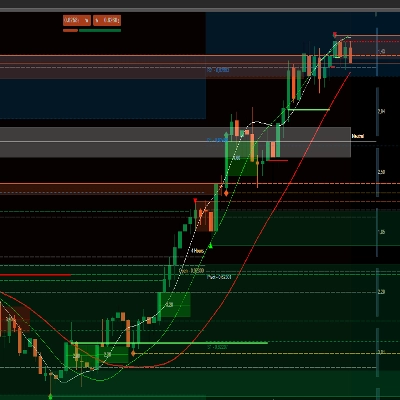
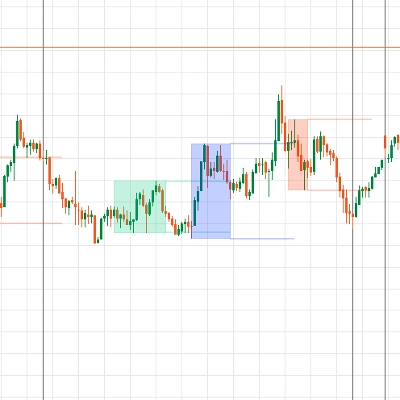
这不仅仅是另一个趋势指标——它是一个完整的可视化交易系统,旨在帮助您发现市场趋势,实时跟踪市场表现,并且清晰分析趋势结果。
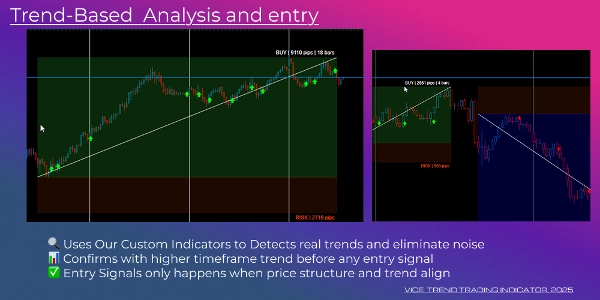
这个高级工具结合了多时间框架趋势分析,实时盈亏叠加显示,以及自动信号箭头,为您带来一个简洁而强大的图表体验。
主要特点:
1. 动态趋势区域(TP/SL 可视化)
摘要
AI 摘要
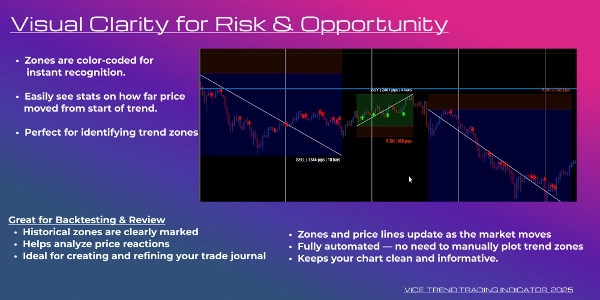
Vice TrendTrading is a comprehensive visual trading indicator designed to identify and track market trends using multi-timeframe analysis. It provides dynamic trend zones that visually mark entry areas, take profit targets, and stop loss levels with high precision. These zones update in real time, displaying profit and loss metrics in dollars, pips, and percentages.
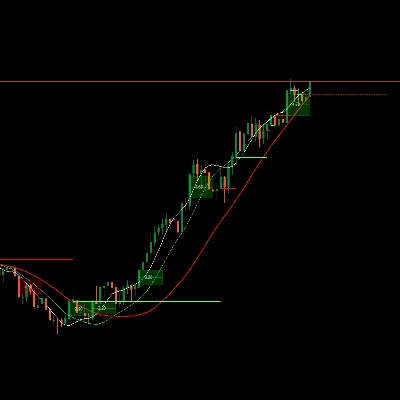
The system includes automatic signal arrows that confirm valid buy and sell entries within active trend zones, ensuring signals appear only at valid entry points without repainting or duplication. It supports historical signal reconstruction for chart replay, allowing users to visually backtest and analyze past market behavior accurately.
Vice TrendTrading manages trend zones automatically by closing and labeling completed zones when trends reverse, maintaining clean and organized charts even in volatile conditions. The indicator features color-coded zones and arrows with annotated profit/loss values for clarity and ease of interpretation.
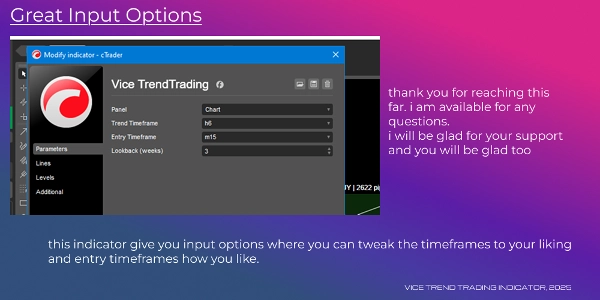
It works on all symbols and any timeframe, with customizable input parameters for trend and entry timeframes. This tool is suited for price action traders, discretionary traders, strategy developers, and anyone seeking a structured, modern chart to make informed trading decisions.
指标配置
讨论
客户评价
4.6
评价:3
5 | 67 % | |
4 | 33 % | |
3 | 0 % | |
2 | 0 % | |
1 | 0 % |
客户评价
July 18, 2025
Two sessions say more than one clean chart, and the market read feels cleaner.
July 15, 2025
not perfect, but the workflow felt cleaner, and A small account test feels safer.
July 7, 2025
Not perfect, but the workflow felt cleaner. It needs a few bad trades in the sample too.
常见问答
cTrader Store 提供的所有产品,包括交易机器人、指标和插件,均由第三方开发者提供,仅供信息参考和技术访问之用。cTrader Store 并非经纪商,不提供投资建议、个人推荐或任何未来业绩保证。








价格

注册日期 17/06/2025