present
Regístrese y obtenga 50 $ de descuento en su primera compra
Trading product for Kalman Filter Trend Indicador Signal Indices, image 1
Kalman Filter Trend
Indicador
Versión 1.0, Nov 2025
Windows, Mac
4.5
Valoraciones: 4
Trading product for Kalman Filter Trend Indicador Signal Indices, image 2
42.11M
Volumen operado
6.13M
Pips ganados
263
Ventas
10.02K
Instalaciones gratis

Descripción

📌 Tendencia del Filtro de Kalman – Resumen y Revisión

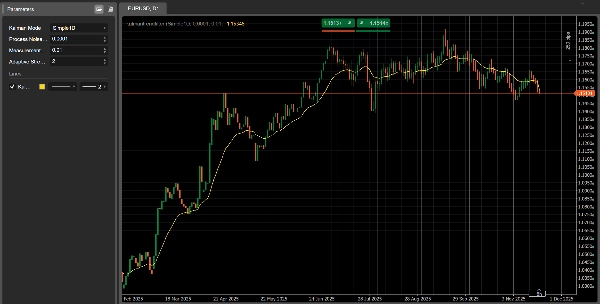
Tendencia del Filtro de Kalman es un indicador avanzado de seguimiento de tendencias para cTrader, diseñado para ofrecer una línea de tendencia suave y altamente sensible con un retraso significativamente menor que los promedios móviles tradicionales.

Donde los filtros clásicos SMA/EMA reaccionan lentamente y a menudo pierden los cambios tempranos de tendencia, el Filtro de Kalman:

  • Actualiza continuamente su estimación del “precio verdadero”
  • Equilibra matemáticamente la suavidad y la capacidad de respuesta
  • Se adapta a la volatilidad (modo Adaptativo)
  • Modela tanto precio como velocidad (modo 2D)

Esto lo convierte en una herramienta poderosa tanto para traders manuales como para desarrolladores de sistemas automatizados.


🎛 Modos y Parámetros

Modo Kalman (3 Versiones en un Indicador)

1️⃣ Simple1D

Un filtro Kalman clásico 1D.
Rápido, limpio y excelente para la detección de tendencias a corto plazo.

2️⃣ PositionVelocity2D

Modela tanto el precio como la velocidad de la tendencia.
Ideal como filtro direccional en estrategias algorítmicas.

3️⃣ Adaptive1D

Se ajusta automáticamente a la volatilidad.
Más reactivo en mercados rápidos, más suave en condiciones tranquilas.


🧩 Parámetros Clave Explicados

  • Ruido del Proceso (Q):
    Mayor = reacción más rápida a la tendencia, menor = línea más suave.
  • Ruido de Medición (R):
    Mayor = el filtro confía menos en los datos → resultado más suave.
  • Fuerza Adaptativa:
    Usado solo en Adaptive1D. Controla qué tan fuertemente la volatilidad afecta al filtro.


📈 Cómo Interpretar las Señales

1. Detectar la Dirección de la Tendencia

  • Tendencia Alcista: Línea inclinada hacia arriba, precio manteniéndose por encima del filtro.
  • Tendencia Bajista: Línea inclinada hacia abajo, precio manteniéndose por debajo del filtro.
  • Lateral: El mercado está en rango, evitar estrategias de ruptura.


2. Señales de Entrada (Lógica de Cruce)

Entrada Alcista:

  • El precio cierra por encima de la línea de Kalman
  • La línea comienza a girar hacia arriba

Entrada Bajista:

  • El precio cierra por debajo de la línea de Kalman
  • La línea comienza a girar hacia abajo


3. Fuerza de la Tendencia (Modo 2D)

La pendiente se convierte en una lectura directa del momentum:

  • Pendiente fuerte hacia arriba → tendencia alcista fuerte
  • Pendiente fuerte hacia abajo → tendencia bajista fuerte
  • Pendiente aplanándose → debilitamiento de la tendencia o fase de transición


📊 Ejemplos Prácticos de Uso

✔ Estrategia de Seguimiento de Tendencia

Usa Simple1D o Adaptive1D:

  • Compra por encima de la línea cuando la pendiente se vuelve positiva
  • Vende por debajo de la línea cuando la pendiente se vuelve negativa

✔ Enfoque Multi-Timeframe

  • Usa Kalman en H1 para la dirección
  • Usa Kalman en M15 para entradas precisas
  • Entra solo en la dirección indicada por el timeframe superior

✔ Integración con Bots

Perfecto para trading algorítmico:

  • Permitir solo largos si la pendiente > 0
  • Permitir solo cortos si la pendiente < 0
  • Usar Adaptive1D para índices volátiles como US500, NAS100, US2000


🌟 Únete a Nuestra Comunidad

Si deseas acceso a:

  • Optimizaciones exclusivas para cada uno de nuestros bots
  • Consejos avanzados de configuración
  • Mejoras en el trading
  • Ayuda técnica personalizada
  • Actualizaciones y nuevas herramientas

👉 Únete a nuestra comunidad haciendo clic en el enlace en mi página de perfil.
Allí encontrarás las mejores configuraciones de optimización para todos nuestros bots, actualizadas regularmente.

Resumen

Resumen de IA
Kalman Filter Trend is an advanced trend-following indicator for cTrader that provides a smooth and highly responsive trend line with minimal lag compared to traditional moving averages. It continuously updates its estimate of the true price by mathematically balancing smoothness and responsiveness, adapting to market volatility in its Adaptive mode, and modeling both price and velocity in its 2D mode.

The indicator offers three modes: Simple1D for fast, short-term trend detection; PositionVelocity2D for modeling price and trend velocity, suitable as a directional filter in algorithmic strategies; and Adaptive1D, which adjusts automatically to volatility for smoother or more reactive behavior depending on market conditions.

Key parameters include Process Noise (Q) controlling trend reaction speed versus smoothness, Measurement Noise (R) affecting data trust and smoothing, and Adaptive Strength for volatility sensitivity in Adaptive1D mode.

Users interpret the indicator by trend direction (uptrend, downtrend, flat), entry signals based on price crossing and slope changes, and trend strength via slope magnitude in 2D mode. It supports various practical uses such as trend-follow strategies, multi-timeframe analysis, and integration into automated trading systems, particularly for indices and volatile markets.
Perfil del indicador

Valoraciones de clientes

4.5
Valoraciones: 4
5
50 %
4
50 %
3
0 %
2
0 %
1
0 %
Valoraciones de clientes
December 5, 2025
November 30, 2025
Good enough to keep watching for another week. 3 sessions is a fair first sample.
November 27, 2025
a small account test feels safer, and the setup needs a cleaner reason to exist.
November 22, 2025

Conversación

Preguntas frecuentes

Signal
Indices
Commodities
GBPUSD
RSI
Bollinger
Fibonacci
Scalping
AI
XAUUSD
NAS100
MACD
BTCUSD
Forex
Breakout
EURUSD
NZDUSD
Martingale
Prop
ZigZag
Supertrend
Fair Value Gap
SMC
Crypto
Grid
Stocks
ATR
USDJPY
VWAP
Los productos disponibles a través de cTrader Store, incluidos bots, indicadores y plugins para operar, son proporcionados por desarrolladores de terceros y están disponibles únicamente con fines informativos y de acceso técnico. cTrader Store no es un bróker, por lo que no proporciona asesoramiento de inversión, recomendaciones personales ni ninguna garantía de rentabilidad futura.

Más de este autor

Indicador
AI
Grid
+17
Editions: Free (core VWAP + bands) · Pro (multi‑VWAP, click‑to‑anchor, alerts).
cBot
AI
ATR
+27
The Prop-Ready Bot The Definitive Automaton for Challenges 🛡️ V2.0
Indicador
AI
ATR
+27
Read aggressive flow in real time. Flexible resets (Day/Week/Month), optional EMA smoothing, and non-repainting cumulati
Logotipo de "True Scalper Ai v4.0"
Estadísticas en vivo
5.0
(4)
$119
/
$238
cBot
Prop
BTCUSD
+5
TrueScalper AI PRO v4.0 turns live market structure into disciplined AI-filtered scalping execution.
20%
ROI
5
Factor de beneficio
Indicador
AI
ATR
+27
Volume Bubbles is a lightweight yet powerful visual indicator for cTrader
cBot
AI
ATR
+21
A price-action-first algorithm to trade Breakout, Approach, and Return around prior High/Low levels—with Prop-style risk
cBot
AI
ATR
+27
N.B.: Results with an initial invested capital of 100 euros.
cBot
AI
ATR
+27
✅ Buy 3 prop accounts and manage just 1: cut management effort by 66% with a professional tool.
Indicador
AI
ATR
+27
Want a cBot based on this indicator? Contact us!
cBot
AI
Prop
+5
Premium algorithmic scalping for funded traders. Capture precise breakouts with ironclad risk management across all majo
14%
ROI
4
Factor de beneficio
Indicador
Prop
Forex
+15
ZigZag Free is a clean swing-detection tool that marks significant pivot highs/lows
Logotipo de "AI Level Trader"
Estadísticas en vivo
4.2
(4)
$129
/
$159
cBot
AI
ATR
+27
AILevelTrader — Multi-AI Consensus Trading Bot 11 AI providers. One consensus. Prop Firm Ready.
1.9
Factor de beneficio

Puede interesarle

Indicador
ATR
RSI
+9
🚀 MACARX Indicator - The Multi-Indicator Trend Fusion 🚀
Indicador
MACD
Forex
+6
Auto Signal BUY SELL is a professional decision-making tool designed to help you follow the trend and capture high-proba
Indicador
AI
ATR
+26
Entry Momentum MACD Power Guide
Indicador
RSI
MACD
+7
The ZigZag indicator is a technical analysis tool primarily used to identify key price reversal points.
Indicador
Volume
Key Levels
+1
Fixed-grid volume profile: bull and bear volume at every price level, with Point of Control and value area.
Indicador
Prop
Forex
+4
This is an indicator that can alert you about trendlines, horizontal lines and vertical lines.
Indicador
Prop
Forex
+10
Support and Resistance Line Indicator with Higher Timeframe Filter
Indicador
ADX
ATR
+5
Scored breakouts of sloped pivot trendlines: four filters on the break bar, ATR stop, 1:1 / 1:2 / 1:3 targets, alerts.
Indicador
Engulfing
Fibonacci
+4
Six higher-timeframe candle sets on one chart, with liquidity sweep detection and swept levels.
Indicador
AI
SMC
+19
ZigZag Pro — Advanced swing detection with ATR threshold, fractal confirmation, and colored segments. Clean market
Indicador
RSI
Signal
+2
Identifies trends with moving averages & volatility. Base levels = bullish 🐂 or bearish 🐻 signals. Reversals detected!
Indicador
ATR
Volume
+3
Fibonacci trend signals on closed bars, with an ATR stop, up to four targets and a break-even ladder.
Indicador
RSI
Breakout
+1
Dynamically adjusts regression channels based on ZigZag extremes, resetting when price breaks bands to track real trends
Indicador
ATR
EMA
+3
EMA trend, RSI reclaim and divergence signals with ATR stop and two targets, swing levels and a 16-row dashboard.
Indicador
VWAP
Volume
+2
VWAP Bands and Swing Wick Structure Indicator
Indicador
Laguerre RSI: smoother, faster RSI with less noise. Great for spotting reversals and timing entries.
Indicador
Prop
Forex
+5
Tracks NY, London, Tokyo, Sydney sessions with custom visuals, and a real-time expanding range box and breakout High/Low
Indicador
Forex
Crypto
+4
Pro Heikin Ashi Visual Overlay – Clean Trend Visualization

Precio

42.11M
Volumen operado
6.13M
Pips ganados
263
Ventas
10.02K
Instalaciones gratis