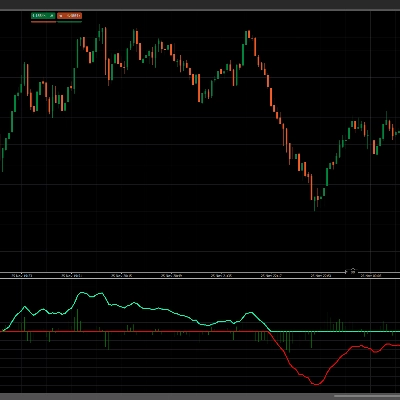
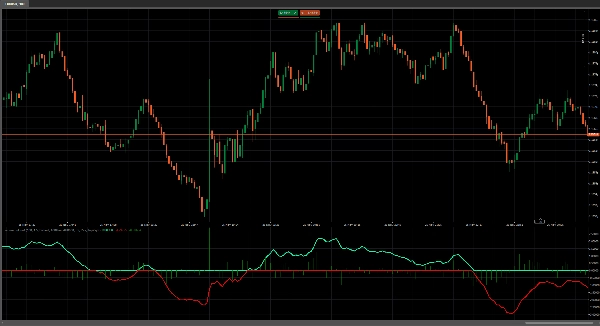
الوسطاء وشركات پروپ
للأعمال
00
Days
:
00
Hours
:
00
Minutes
:
00
Seconds
مؤشر
NAS100
NZDUSD
Martingale
Forex
Fibonacci
EURUSD
MACD
BTCUSD
SMC
Indices
ATR
Stocks
Grid
RSI
Breakout
XAUUSD
FVG
Commodities
Signal
Bollinger
GBPUSD
AI
VWAP
ZigZag
Prop
Supertrend
Crypto
USDJPY
Scalping
z-score colored
22/12/2025
Desktop
منذ 12/03/2025
المبيعات
16
التثبيتات المجانية
35
صورة "z-score colored" المحملة

The Rolling Z-Score Trend is a refined momentum indicator engineered for traders who demand clarity and precision.
It reveals true bullish and bearish pressure through a smooth Z-Score curve, enhanced with dynamic EMA filtering and a discreet momentum histogram.
Threshold lines and adaptive presets deliver an elegant, data-driven view of trend strength—clean, balanced, and effortlessly readable.
A premium tool designed to elevate decision-making with sophistication and accuracy.

0.0
التقييمات: 0
تقييمات العملاء
لا توجد تقييمات لهذا المنتج حتى الآن. هل جرَّبته بالفعل؟ كن أول من يخبر الآخرين!
المزيد من هذا المؤلف
مؤشر
Grid
NAS100
RSI
+19
Know sure thing
Know Sure Thing (KST) momentum engine
مؤشر
Grid
RSI
Breakout
+19
Buy and sell indicator
Buy and Sell Signals
مؤشر
Grid
Breakout
Martingale
+4
Coloring Trendline with arrows
Coloring trendline/ Colored Trendline / Color Trendline
مؤشر
NAS100
NZDUSD
Martingale
+26
overbought oversold
Overbought Oversold Indicator
مؤشر
NAS100
NZDUSD
Martingale
+25
Aggressive Entry Momentum MACD Power Guide
Entry Momentum MACD Power Guide
مؤشر
NAS100
NZDUSD
Martingale
+26
The Professional “All-in-One” Trading Suite
The Professional “All-in-One” Trading Suite (buy and sell indicator)
مؤشر
NAS100
NZDUSD
Martingale
+26
Support and Resistance
Support and Resistance with signals
مؤشر
Grid
XAUUSD
Breakout
+12
heatmap kopie
Dynamic Liquidity Depth exposes hidden volume
مؤشر
Grid
Indices
Breakout
+9
crossover 1
Crossover Buy and Sell Alerts and signals
مؤشر
Grid
NAS100
RSI
+20
vrvp
Volume Range Volume Profile
مؤشر
NAS100
NZDUSD
Martingale
+26
Colored Power MACD MA line
Ultra-clean precision MACD momentum logic
مؤشر
RSI
FVG
Commodities
+12
VWAP EMA CROSSOVER
VWAP (EMA) + MVWAP Mean Line — plotted directly on the main chart
قد يعجبك أيضًا
مؤشر
RSI
Breakout
Supertrend
TrendMaster Pro MultiMA
Connects each moving average value from candle to candle, forming a fan-like structure of trendlines.
مؤشر
NAS100
NZDUSD
Martingale
+25
Liquidity Cluster Order
Liquidity Cluster Order automatically detects and draws accumulation zones & distribution zones
Break of Structure
The Break of Structure (BoSCHoCh) Indicator is a smart market structure tool designed to help traders easily spot trend.
مؤشر
XAUUSD
Volume Profile Fixed Range - Pro
Professional Volume Profile Indicator - Shows volume distribution, POC, Value Areas & Buy/Sell pressure.
Fx4U.Multi Trend Line Indicator
Allow trader to draw multi trendlines in different timeframes on one chart,Give trader an overview of the current market
مؤشر
Grid
NAS100
RSI
+20
vrvp
Volume Range Volume Profile
مؤشر
Grid
NAS100
XAUUSD
+6
AutoFibRetracement
A powerful overlay tool designed to automatically plot Fibonacci retracement levels based on a custom window.
مؤشر
VWAP
NAS100
XAUUSD
+7
Vwap Manav Indi Button
Automated VWAP bot executes trades at key volume-weighted average price zones with adaptive risk management
مؤشر
NAS100
Indices
XAUUSD
+9
HAIQuantum_TheGameV2
This trading game allows you to explore and practice investment strategies in a real-time market data environment.
مؤشر
NAS100
NZDUSD
XAUUSD
+15
SuperTrend from TradingView
Get the exact SuperTrend experience from TV, now perfectly rebuilt for cTrader
مؤشر
Indices
Prop
Stocks
+3
Fractals
Fractals is a precision-engineered trading indicator for cTrader that reveals the hidden architecture of price action.
مؤشر
NAS100
Indices
XAUUSD
+2
AlgoCorner DonchianPSAR
Visualize market asymmetry like never before — steady climbs meet sudden drops with the Donchian PSAR
VWAP Tokyo Open
VWAP Set to Tokyo Open
Moving Average Plus
10 configurable moving averages: choose type, period, color per line; single price source for all.
KDJ
The KDJ oscillator display consists of 3 lines (K, D and J - hence the name of the display) and 2 levels.
Insider_CumulativeDelta
Robust Cumulative delta,Atr and imbalance indicator.
مؤشر
Indices
Prop
Breakout
+4
Higher TimeFrame Candle Tracker
Higher TimeFrame Candle Tracker: Current Timeframe (Any TimeFrame) Show High TimeFrame Candle Bar
مؤشر
NAS100
NZDUSD
Breakout
+14
Adaptive Trailing System
🚀 Adaptive trailing stop that uses logarithmic normalized volatility....