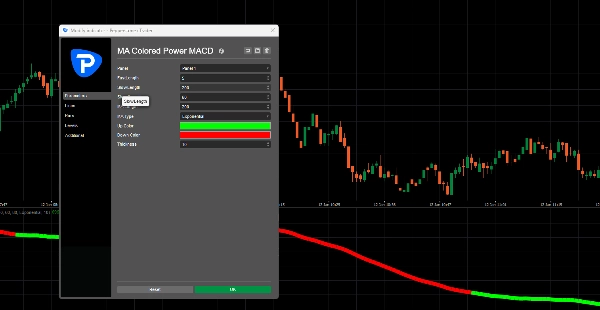
MACD ColorFlow Moving Average
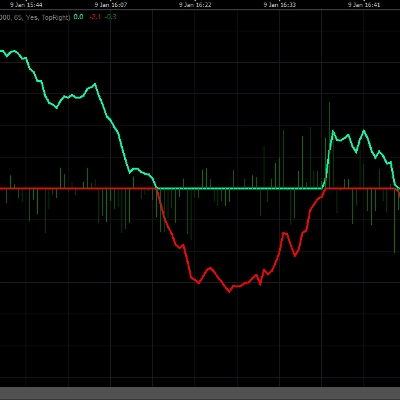
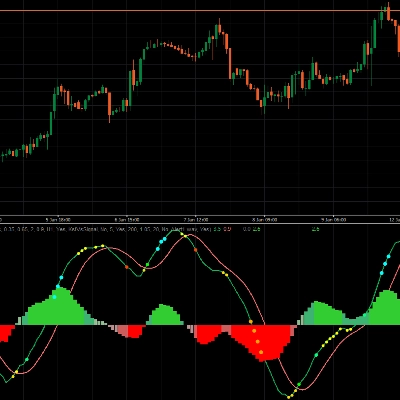
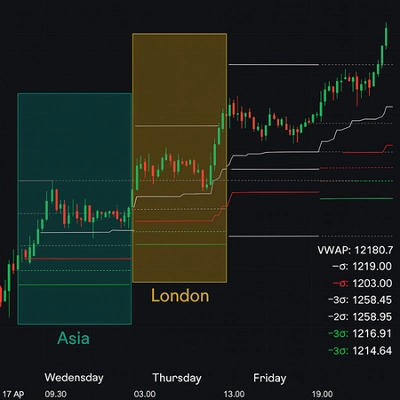
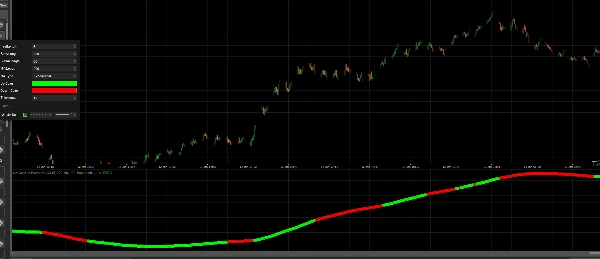
Works both on-chart or in a separate panel (see pictures)
Recommended baseline: US500 • Tick 30 (T30) for best clarity (use default settings)
A clean, visual trend line driven by MACD momentum—designed to make direction changes instantly obvious, without clutter.
Overview
MACD ColorFlow Moving Average takes a smooth moving average and colors it dynamically based on MACD conditions (MACD vs Signal).
Instead of watching multiple oscillators, you get a single calm “reference line” that flips color when momentum bias changes—ideal for fast decision-making and clean chart reading.
✅ Works both on-chart or in a separate panel
Use it directly on price as a trend overlay, or place it in its own indicator pane for a distraction-free bias display.
What It Does (In Plain English)
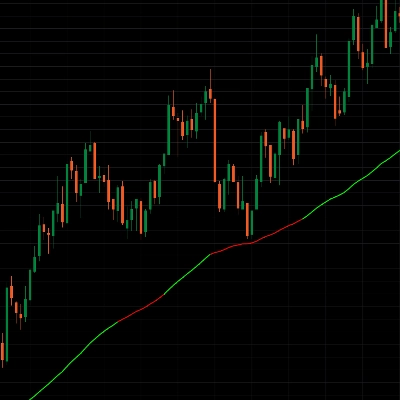
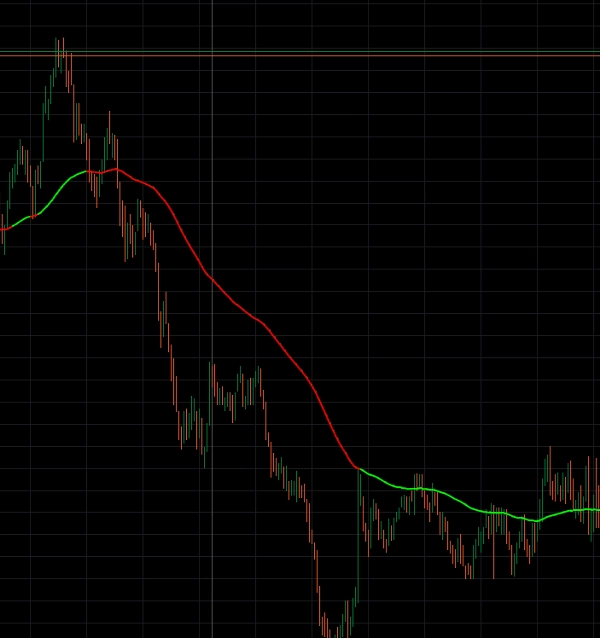
- A smooth Moving Average (your chosen length/type) is plotted as a continuous line.
- The indicator calculates a TradingView-style MACD (Fast EMA − Slow EMA) and its Signal line.
- When MACD is above Signal, the MA segment turns bullish color (e.g., Lime).
- When MACD is below Signal, the MA segment turns bearish color (e.g., Red).
This creates a “flowing” color line that visually tracks regime changes.
Key Features
✅ Color-Switch MA Based on MACD Bias
The moving average acts as a calm baseline, while the color communicates momentum direction.
✅ TradingView-Style MACD Logic
Uses the familiar MACD relationship (MACD vs Signal) to determine bullish/bearish state.
✅ Smooth Reference Line (Non-Noisy)
Designed to stay readable even on busy charts—great for traders who want clarity.
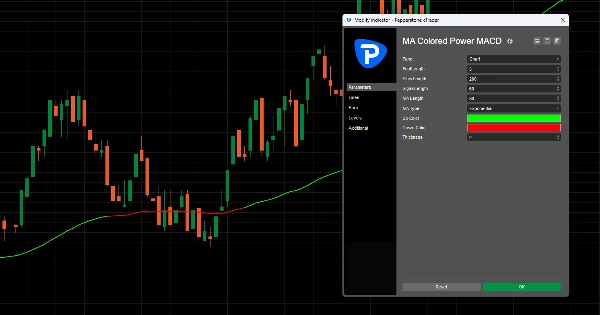
✅ Customizable
- MACD fast/slow/signal lengths
- MA length + MA type (EMA/SMA/etc.)
- Bullish/Bearish colors
- Line thickness
✅ Performance-Safe Object Cleanup
Old segments are automatically removed to keep the chart responsive.
✅ Works both on-chart or in a separate panel
Perfect as:
- a price overlay for trend context, or
- a separate-pane “bias strip” when you want a clean chart.
How Traders Use It
Trend Filter
- Only take longs when the line is in bullish color
- Only take shorts when the line is in bearish color
Timing & Confirmation
- Use the color flip as confirmation after a structure break or pullback.
- Use the MA itself as a dynamic area for “return-to-mean” style entries.
Chop Avoidance
- If the line flips rapidly, conditions are likely choppy—reduce size, wait for structure, or increase smoothing.
Best Use Cases
- Trend-following and pullback systems
- Scalping confirmations (with faster MACD settings)
- Swing bias filtering (with slower MACD + longer MA)
- Any trader who wants a simple “green/red regime line” without extra panels full of noise
Suggested Starting Presets
Intraday / Scalping
- FastLength: 5
- SlowLength: 60–100
- SignalLength: 20–30
- MA Length: 50–80 (EMA)
Swing / Trend
- SlowLength: 100–200
- MA Length: 80–150 (EMA or SMA)
Disclaimer
This indicator is for analysis and educational purposes only. It does not guarantee results. Always use proper risk management and confirm signals with your trading plan.