
설명
적응형 트레일링 시스템 🚀
적응형 트레일링 시스템은 로그 정규화 변동성 을 사용하여 이익 보호 수준을 자동으로 조정하는 고급 적응형 트레일링 스톱입니다. 📊 고정 거리의 전통적인 트레일링 스톱과 달리, 이 시스템은 시장의 실제 변동성을 기반으로 동적 거리를 계산하여 변화하는 조건에 지속적으로 적응합니다. 🔄
Spotware GBPUSD 691360763c684 | cTrader
Spotware XAUUSD 691360adf1386 | cTrader
Spotware XAUUSD 691360adf1386 | cTrader
독특한 적응형 트레일링 알고리즘 ⚙️
시스템은 통계적 방법 을 사용하여 동일한 트레일링 거리를 생성하지 않습니다:
• 구성 가능한 기간 동안 가격의 진정 범위(True Range) 를 계산합니다.
• 이러한 값에 로그 변환 을 적용하여 분포를 정규화합니다.
• 이 로그 값들의 평균과 표준 편차 를 계산합니다.
• 변동성 수준(0, 1, 2 또는 3 표준 편차)에 따라 고유한 오프셋 거리 를 생성합니다. 🎯
• 트레일링 스톱은 전형적인 가격 (고가, 저가, 종가의 평균)를 사용하여 지속적으로 조정됩니다.
결과: 각 시장 순간마다 해당 맥락의 특정 변동성에 따라 계산된 고유한 트레일링 거리가 있습니다. 🤖
기술적 기반: 로그 정규화 변동성 🧠
왜 로그 변환인가요? 🤔
시장 변동성은 정규(가우시안) 분포를 따르지 않으며 극단적인 값을 가지는 경향이 있습니다. 로그 변환은:
- 분포를 정규화합니다: 왜곡된 데이터를 보다 대칭적인 분포로 변환합니다.
- 분산을 안정화합니다: 극단적인 변동성 급증의 영향을 줄입니다.
- 통계적 비교를 가능하게 합니다: 표준 편차를 의미 있게 사용할 수 있게 합니다.
오프셋 계산 과정 🔢
- 기간 진정 범위: 기간의 고가-저가 및 이전 종가와의 갭을 고려하여 최대 범위를 측정합니다.
- 자연 로그:
ln(True Range)를 적용하여 정규화합니다. - 정규화 창: 마지막 N개의 로그 값을 유지합니다(정규화 기간).
- 로그 평균: 창 내 모든
ln(TR)값의 평균입니다. - 표준 편차: 로그 값들의 분산을 계산합니다.
- 변동성 수준: 설정에 따라 편차에 0, 1, 2 또는 3을 곱합니다.
- 최종 오프셋:
Offset = e^(mean + level × deviation)- 가격 스케일로 다시 변환합니다. 💡
작동 방식? ⚡
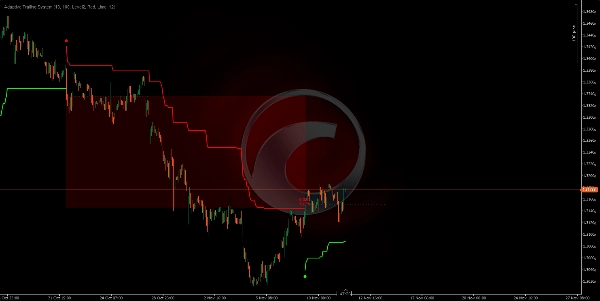
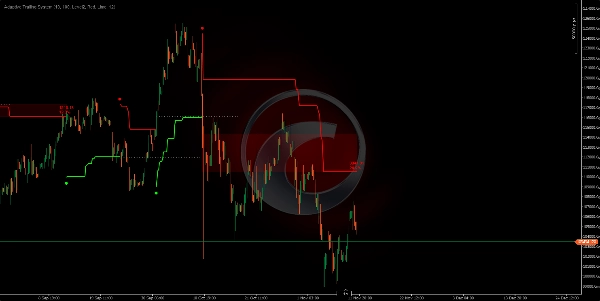
양방향 트레일링 메커니즘
시스템은 두 가지 교대 모드로 작동합니다:
약세 모드 (숏): 📉
• 트레일링 스톱은 가격 위에 설정됩니다.
• 가격이 하락할 때 하향 으로 업데이트되며(절대 상승하지 않음).
• 가격이 트레일링 스톱을 종가로 넘어설 때 반전 신호가 발생합니다.
강세 모드 (롱): 📈
• 트레일링 스톱은 가격 아래에 설정됩니다.
• 가격이 상승할 때 상향 으로 업데이트되며(절대 하락하지 않음).
• 가격이 트레일링 스톱을 종가로 밑돌 때 반전 신호가 발생합니다.
반전 신호:
• 원형 점은 추세 변화 (새 포지션 진입)를 표시합니다.
• 녹색 = 새로운 강세 추세 (). ✅
• 빨간색 = 새로운 약세 추세 (). 🔴
매개변수 및 영향 🎛️
계산 기간 (10)
- 기능: 진정 범위를 계산하는 데 사용되는 바의 수를 정의합니다.
- ↑ 높음 (20-50): 장기 변동성을 측정하며, 더 부드럽고 덜 민감합니다.
- ↓ 낮음 (5-8): 단기 변동성을 측정하며, 더 반응적이고 빠른 변화를 감지합니다.
정규화 기간 (100)
- 기능: 평균과 표준 편차를 계산하기 위한 로그 값의 창 크기입니다.
- ↑ 높음 (200-500): 더 안정적인 정규화, 오프셋의 점진적 변화.
- ↓ 낮음 (50-80): 더 반응적인 정규화, 오프셋이 더 빠르게 적응합니다.
- 중요한 영향: 이 매개변수는 과거 변동성 맥락이 얼마나 "기억"되는지를 결정합니다. 🧠
변동성 수준 (레벨 2)
- 기능: 오프셋 계산에 적용되는 표준 편차의 수입니다.
- 레벨 0 (0σ): 오프셋 = 로그 평균 = 가장 좁은 거리, 최대 민감도. 🎯
- 레벨 1 (1σ): 오프셋에 1 표준 편차 포함 = 중간 거리, 약 68% 변동성 포착.
- 레벨 2 (2σ): 오프셋에 2 표준 편차 포함 = 더 넓은 거리, 약 95% 변동성 포착 (균형 잡힌). ⚖️
- 레벨 3 (3σ): 오프셋에 3 표준 편차 포함 = 매우 넓은 거리, 약 99% 변동성 포착, 최대 허용치. 🛡️
___________________________________________________________________________________________________
🚀 10,000명 이상의 트레이더가 이미 우리의 TOP 지표🏆
👉 모든 TOP 시스템을 여기에서 받으세요:
_______________________________________________
📌 시장 구조 지표
· ✅ AdvancedMarket Structure: Bos, Choch, SwinLevels, Order Blocks, Market Structure& Liquidity Finder
· 🔄 Dynamic Market StructureAnalysis of Turning Points
· 🧱 Order Block
· ⚖️ Market Imbalance
· ⛓️ BOS & CHOCH
· 🧠 ICT Power of 3
_______________________________________________
🔚 스마트 종료 시스템
_______________________________________________
📐 지그재그 지표
· 🔍 ZigZag Price LiquidityProjection
· ➖ ZigZag
_______________________________________________
🧱 지지 및 저항 지표
· 🟩 SmartTrend Support &Resistance Lines
· 🧱 All Support and ResistanceLevels
_______________________________________________
📊 추세 및 채널 지표
· 📊 Supertrend
_______________________________________________
💧 거래량 및 유동성 도구
_______________________________________________
⚡ 모멘텀 및 RSI 지표
· 🔎 Multi-Level Candle Bias
Tracker
_______________________________________________
🔮 예측 및 투영 도구
· 📐 Prediction Based on Linreg& ATR
· 📏 Fibonacci Linear RegressionMulti-timeframe
· 📈 Volume-Powered Market Flow Projector_________________________________________________________________________________________________
요약
The system operates bidirectionally with two modes:
- Bearish (short) mode places the trailing stop above the price, adjusting downward as price falls, signaling a reversal when price closes above the stop.
- Bullish (long) mode places the trailing stop below the price, adjusting upward as price rises, signaling a reversal when price closes below the stop.
Reversal signals are visually marked with colored dots indicating trend changes (green for bullish, red for bearish). Key parameters include the calculation period for True Range, normalization period for volatility data, and volatility level defining the offset distance based on standard deviations.
This indicator supports various markets including Forex, cryptocurrencies, commodities, indices, and stocks, with symbols such as BTCUSD, EURUSD, GBPUSD, XAUUSD, NAS100, and USDJPY. It is designed to provide adaptive trailing stops that respond to real-time volatility, enhancing trade exit strategies.


!["[Stellar Strategies] Smart ADX" 로고](https://cdn.ctrader.com/image/webp/af13b084-b6f6-41db-b7bc-c7e688b57b05_36929)


