
설명
Schaff 트렌드 사이클(STC)은 유명한 기술 분석가 Doug Schaff가 개발한 고급 거래 지표로, 탁월한 속도와 정확성으로 시장 추세와 반전을 식별하도록 설계되었습니다. 추세와 사이클 구성 요소를 결합하는 혁신적인 아이디어에 뿌리를 두고 있으며, STC는 지수 이동 평균(EMA)과 스토캐스틱 계산을 활용하여 MACD나 스토캐스틱 오실레이터와 같은 후행 지표의 한계를 극복합니다. 이 독특한 접근법은 더 빠르고 신뢰할 수 있는 거래 신호를 제공하여 추세 감지와 시장 분석에서 중요한 우위를 제공합니다.
주요 특징:
- 조기 추세 감지: 지수 이동 평균(EMA)과 스토캐스틱 계산을 결합하여 추세를 더 빠르게 포착합니다.
- 사용자 설정 가능: 길이, 빠른 MA, 느린 MA, MA 유형 및 평활 계수를 조정하여 거래 전략에 맞출 수 있습니다.
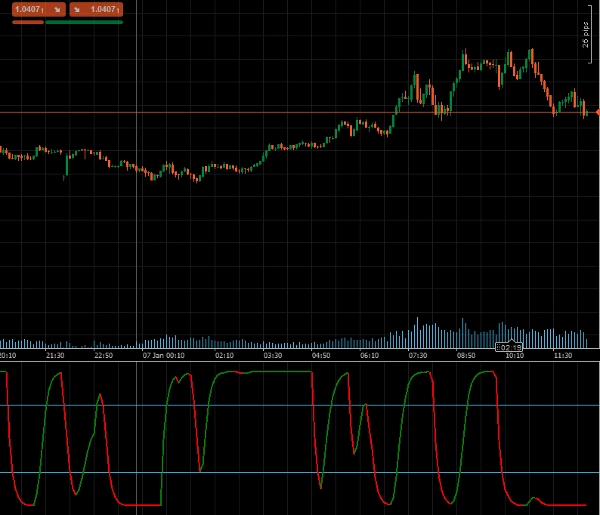
- 시각적 알림: 동적 색상 변화로 강세 또는 약세 추세를 표시하여 시장 상황을 쉽게 해석할 수 있습니다.
- 과매수/과매도 수준 지원: 내장된 수준(25 및 75)이 잠재적 시장 전환점을 식별하는 데 도움을 줍니다.
매개변수
- 길이: 추세 계산을 위한 기간 수를 정의합니다.
- 빠른 MA 길이: 빠른 이동 평균의 길이를 설정합니다.
- 느린 MA 길이: 느린 이동 평균의 길이를 지정합니다.
- MA 유형: 이동 평균 유형(예: EMA, SMA)을 선택할 수 있습니다.
- 평활 계수: 정제된 추세 신호를 위한 평활 계수를 조정합니다.
출력
- STC: 추세 방향과 강도를 나타내는 주요 Schaff 트렌드 사이클 값을 출력하며, 자동 거래 시스템에서 프로그램적으로 사용됩니다.
- STCBull: 강세 추세 조건을 강조합니다.
- STCBear: 약세 추세 조건을 강조합니다.
요약
지표 프로필
고객 리뷰
5.0
리뷰: 2
5 | 100 % | |
4 | 0 % | |
3 | 0 % | |
2 | 0 % | |
1 | 0 % |
고객 리뷰
August 12, 2025
Pros: Fast and accurate trend detection, earlier signals than MACD, customizable levels. Cons: No alerts, no MTF mode, no trade statistics.
상담
자주 묻는 질문(FAQ)
MACD
트레이딩 봇, 지표, 플러그인 등 cTrader Store에서 제공되는 상품은 제3자 개발자에 의해 제공되며, 이는 단순히 정보 및 기술적 접근을 목적으로 제공된 것입니다. cTrader Store는 중개인이 아니며, 투자 조언, 개인별 추천 또는 향후 성과에 대한 어떠한 보장도 제공하지 않습니다.
이 작성자의 상품 더 보기


가격
가입일 24/09/2024
4.47K
무료 설치