
설명
문제: 정보 과부하
대부분의 트레이더는 차트가 후행 지표와 너무 많은 선들로 복잡해져서 실패합니다. 그들은 가장 중요한 것을 놓칩니다: 시장 구조.
해결책: 트렌드 바이어스 구조
이 지표는 cTrader 플랫폼을 위한 "두 가지 기능을 하나로" 합친 강력한 도구입니다. 전문적인 스윙 감지와 객관적인 점수 엔진을 결합하여 시장을 누가 지배하고 있는지 정확히 알려줍니다.
주요 특징:
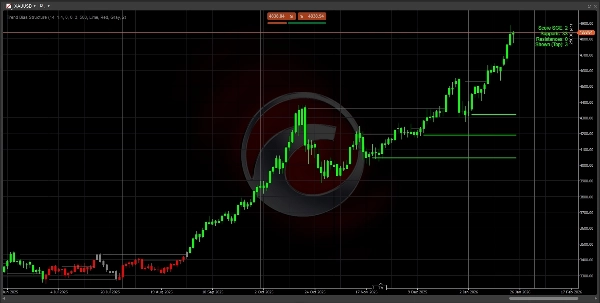
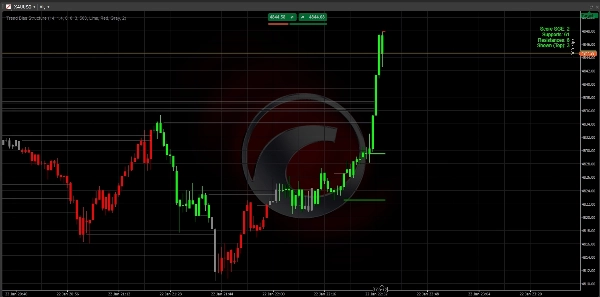
- 스마트 구조 매핑: ATR 필터링된 변동성을 사용하여 중요한 지지 및 저항 수준을 자동으로 식별합니다.
- SGE 점수 엔진: 구조적 레벨이 얼마나 많이 돌파되었는지에 따라 추세 강도를 계산하는 독특한 등급 시스템(-2, 0, +2)입니다.
- 안티 클러터 기술: 현재 가격과 가장 가까운 관련 레벨 3개만 표시합니다. 차트가 깔끔하고 전문적이며 실행 가능하게 유지됩니다.
- 모멘텀 감지: "빅 캔들" 논리를 사용하여 실제 기관의 지지가 있는 움직임만 거래하도록 보장합니다.
- 완전 맞춤 설정 가능: 특정 자산(XAUUSD, 외환, 지수)에 맞게 민감도를 조정할 수 있습니다.
사용 방법:
- 점수 확인: +2 (강세) 또는 -2 (약세)를 찾으세요.
- 되돌림 대기: 가격이 그려진 구조선 중 하나로 돌아오기를 기다리세요.
- 실행: 바이어스를 따라 거래하며, 레벨을 진입/청산 기준점으로 사용하세요.
기술 사양
- 플랫폼: cTrader
- 언어: C# (.NET)
- 타임프레임: 모든 타임프레임에서 작동 (M1부터 월간까지).
- 자산: 유동성이 높은 페어에 최적화 (XAUUSD, EURUSD, GBPUSD).
참고: 초기 설정: 대부분의 주요 페어에 대해 기본 설정이 최적화되어 있습니다. 변동성이 큰 지수를 거래하는 경우 Range Global ATR Mult 값을 2.0으로 높이는 것이 좋습니다.
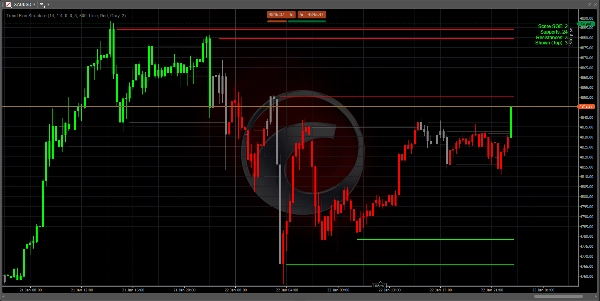
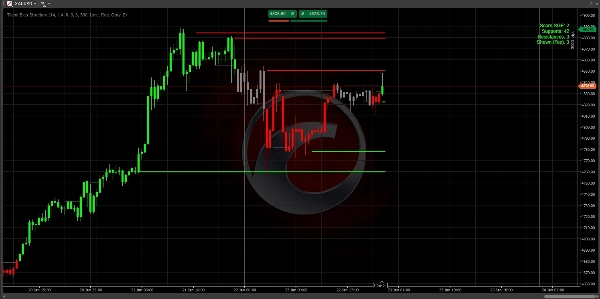
중요: 대시보드 읽기
우측 상단의 대시보드는 당신의 지휘 센터입니다:
- 점수 +2 (녹색): 강한 강세. 오직 매수 신호만 찾으세요.
- 점수 -2 (빨강): 강한 약세. 오직 매도 신호만 찾으세요.
- 점수 0 (회색): 중립. 시장이 횡보하거나 전환 중입니다. 인내심을 가지세요.
- 지지/저항: 현재 추세에 존재하는 과거의 "바닥"과 "천장" 수를 보여줍니다.
3단계 진입 전략
1단계: 바이어스 식별 캔들 색상과 대시보드 점수가 +2 또는 -2에 도달할 때까지 기다리세요. 이는 시장이 구조를 깨고 추세가 시작되었음을 확인합니다.
2단계: 가치 영역 가격을 쫓지 마세요. 가격이 차트에 그려진 가장 가까운 3개 선 중 하나로 되돌림(리트레이스먼트)할 때까지 기다리세요.
- 하락 추세(점수 -2)에서는 가격이 빨간 선에 닿을 때까지 기다리세요.
- 상승 추세(점수 +2)에서는 가격이 초록 선에 닿을 때까지 기다리세요.
3단계: 실행 가격이 선에 닿고 거부 신호(윅 형성)를 보일 때 거래에 진입하세요.
- 손절매: 구조선 바로 뒤에 손절매를 설정하세요.
- 이익 실현: 추세 방향의 다음 구조선을 목표로 하세요.
성공을 위한 전문가 팁
- 상위 타임프레임 우선: H4 또는 D1 차트에서 +2 점수는 M5 차트 점수보다 훨씬 강력합니다. 상위 타임프레임으로 바이어스를 찾고 하위 타임프레임으로 진입점을 찾으세요.
- 깔끔한 차트: 화면이 복잡하게 느껴지면 설정에서
Max Levels to Show값을 2로 변경하세요. 이렇게 하면 가장 중요한 "바닥"과 "천장"만 표시됩니다. - "제로" 존: 점수가 0일 때, 시장은 "재계산" 중입니다. 이때가 이전 거래에서 이익을 실현하고 새로운 돌파를 기다리기에 가장 좋은 시기입니다.
문제 해결
- 선이 보이지 않나요? 차트에 충분한 과거 데이터가 로드되어 있는지 확인하세요. 이 지표는 ATR과 스윙 레벨을 계산하기 위해 최소 100-200개의 바가 필요합니다.
- 지표 지연? PC가 느리면
Max Historical Lines설정을 200으로 줄여 메모리를 더 빨리 정리하세요.
자주 묻는 질문 (FAQ)
Q: 이 지표는 리페인트 되나요?
A: 아닙니다. 레벨과 점수는 확인된 캔들 마감을 기준으로 계산됩니다. 캔들 마감 시 레벨이 돌파되거나 점수가 변경되면, 이는 기록에 고정됩니다.
Q: 어떤 타임프레임이 가장 좋나요?
A: 논리는 보편적입니다. 그러나 대부분의 전문 트레이더는 "기관 구조"를 식별하기 위해 H1, H4, 또는 일간 차트를 사용합니다. M1 또는 M5에서 스캘핑하는 경우 점수 변경이 더 자주 발생할 수 있습니다.
Q: 다른 지표와 함께 사용할 수 있나요?
A: 네! "방향 필터"로 완벽하게 작동합니다. 예를 들어, 트렌드 바이어스 점수가 +2일 때만 RSI 과매도 신호를 활용하세요.
행복한 거래 되세요!
재정적 조언 아님. 트렌드 바이어스 구조 지표는 시장 구조와 추세 바이어스를 식별하는 데 도움을 주기 위한 기술적 분석 도구입니다.
요약
Key features include:
- Smart Structure Mapping: Automatically detects significant support and resistance levels filtered by ATR-based volatility.
- SGE Scoring Engine: Calculates trend strength by counting breached structural levels.
- Anti-Clutter Display: Shows only the three closest relevant levels to maintain chart clarity.
- Momentum Detection: Uses "Big Candle" logic to highlight moves with institutional backing.
- Customizable sensitivity for different assets such as XAUUSD, EURUSD, GBPUSD, and indices.
The indicator works on all timeframes from 1 minute to monthly, with professional traders typically using H1, H4, or daily charts to identify institutional structure. The dashboard provides a clear bias score and structural levels to guide trade entries and exits. Users are advised to trade with the bias, waiting for price pullbacks to the nearest structure lines before executing trades.
This tool is intended as a directional filter and can be combined with other indicators like RSI. It does not repaint, as calculations are based on confirmed candle closes.
고객 리뷰
5 | 100 % | |
4 | 0 % | |
3 | 0 % | |
2 | 0 % | |
1 | 0 % |


!["[Hamster-Coder] Pivot Points MTF" 로고](https://cdn.ctrader.com/image/webp/4c143e5a-309c-40e3-a578-f04d1e133ffa_31159)


