الوصف
🚀 حوّل مخططك إلى مركز قرار استراتيجي
تحليل سمارت تك ليس مجرد مؤشر.
إنه لوحة تحكم تحليل ذكية كاملة، تم تطويرها للمتداولين الذين يرغبون في الوضوح والدقة والسرعة في اتخاذ القرار.
بينما تقدم معظم المؤشرات معلومات معزولة فقط، يدمج تحليل سمارت تك:
✔ الاتجاه
✔ الحجم
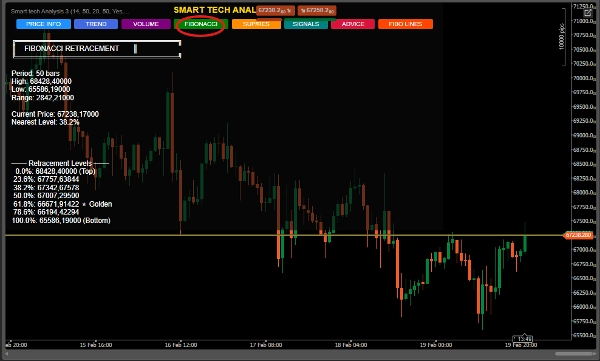
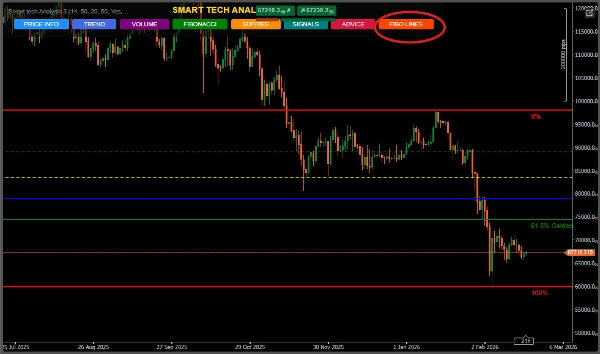
✔ فيبوناتشي
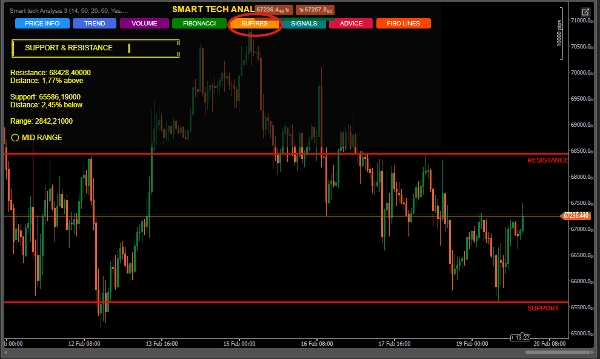
✔ الدعم والمقاومة
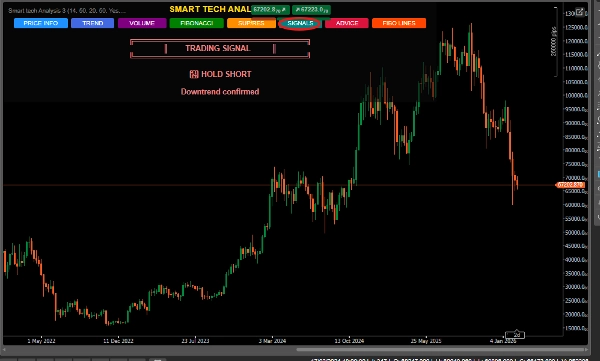
✔ الإشارات التقنية
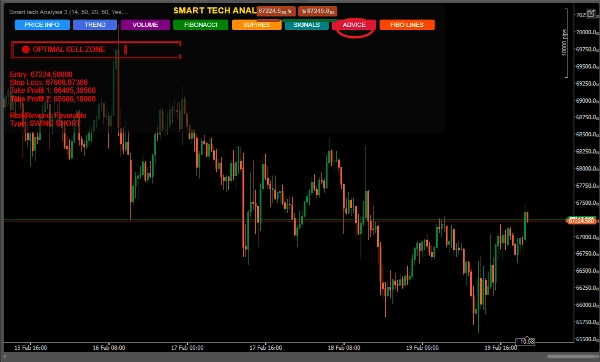
✔ التوصيات التشغيلية
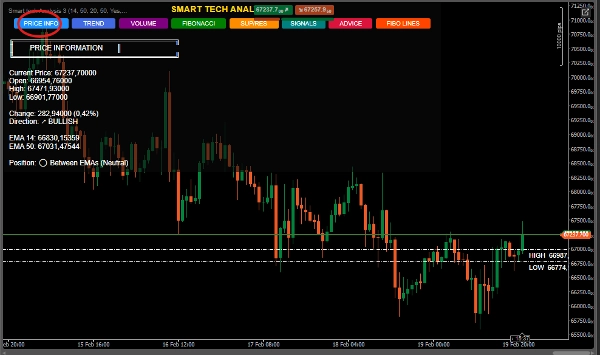
✔ معلومات سعرية مفصلة
كل ذلك في لوحة تحكم ديناميكية وتفاعلية واحدة.
🔥 الفرق الكبير
🎯 1. نظام 6 في 1 – تحليل متكامل
لم تعد بحاجة للتنقل بين مؤشرات متعددة.
يجمع تحليل سمارت تك بين:
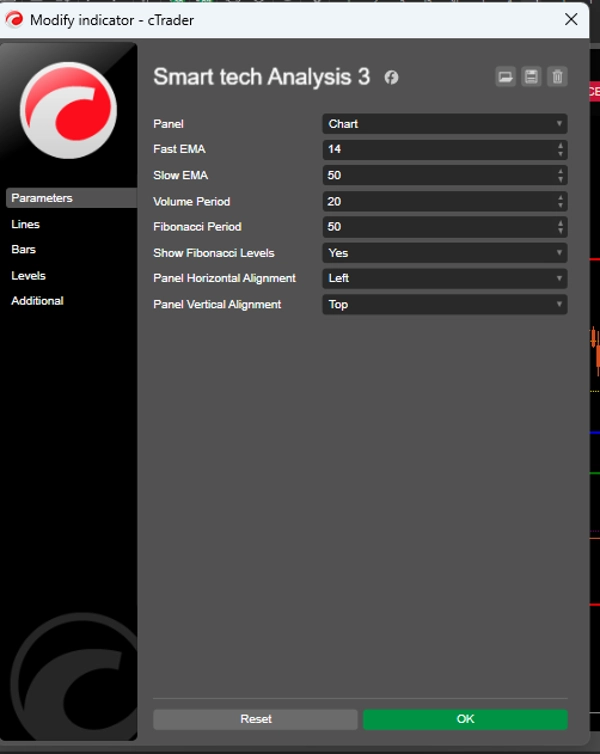
📈 المتوسطات المتحركة السريعة والبطيئة (14 و 50)
📊 الحجم مع التحليل المقارن
🧩 فيبوناتشي تلقائي
🛡 دعم ومقاومة ديناميكية
🚦 توليد إشارات ذكية
📌 توصيات مع وقف خسارة وهدف محسوب
👉 هذا يقلل من الضوضاء البصرية ويزيد من الموضوعية.
🧠 2. لوحة تفاعلية حصرية
واجهة احترافية مع أزرار ذكية:
معلومات السعر
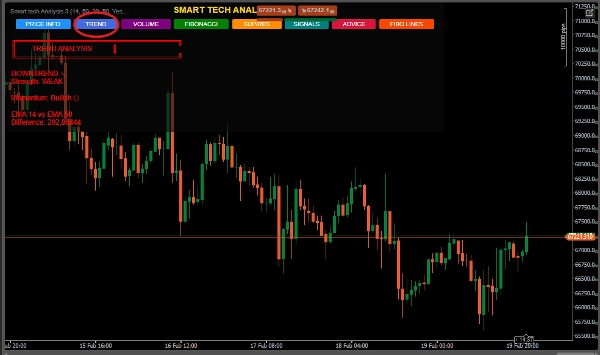
الاتجاه
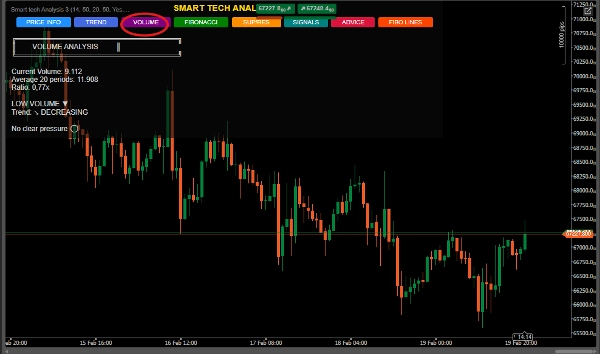
الحجم
فيبوناتشي
الدعم/المقاومة
الإشارات
النصائح
يختار المتداول بالضبط ما يريد رؤيته.
📌 التنظيم.
📌 التحكم.
📌 الاحترافية.
📈 3. تحليل الاتجاه مع القوة والزخم
لا يظهر فقط ما إذا كان يتجه صعودًا أو هبوطًا.
إنه يحسب:
شدة الاتجاه
نسبة القوة بين المتوسطات المتحركة
التصنيف: ضعيف، معتدل، أو قوي
هذا يتجنب الدخولات الضعيفة في الأسواق الجانبية.
📊 4. الحجم مع قراءة مؤسسية
يحدد النظام:
حجم مفرط
ضغط الشراء أو البيع
التسارع أو التباطؤ
المقارنة مع المتوسط التاريخي
👉 مثالي لاكتشاف النشاط المؤسسي المحتمل.
🧩 5. فيبوناتشي تلقائي مع المنطقة الذهبية
يتم حسابه ديناميكيًا على الفترة المحددة.
تسليط خاص على:
⭐ منطقة 61.8% (المنطقة الذهبية)
📌 تحديد المستوى الأقرب
📌 امتدادات صاعدة وهابطة
📌 توصية سياقية تلقائية
مثالي لمتداولي التصحيحات والمتأرجحين.
🛡 6. دعم ومقاومة ذكية
يكشف عن القمم والقيعان المهمة
يعرض المسافة النسبية من السعر الحالي
يصنف الموقع: قرب الدعم، المقاومة، أو منتصف النطاق
يرسم خطوطًا تلقائية على المخطط
مثالي للدخول في المناطق الاستراتيجية.
🚦 7. نظام إشارة التقاء
الخوارزمية لا تولد إشارات عشوائية.
إنها تجمع بين:
✔ تقاطع المتوسطات المتحركة
✔ القرب من الدعم/المقاومة
✔ هيكل الاتجاه
✔ سياق السعر
التصنيف:
🟢 شراء قوي
🔴 بيع قوي
📈 الاحتفاظ بالشراء
📉 الاحتفاظ بالبيع
⏸ الانتظار
مع مستوى الثقة المشار إليه.
🎯 8. التوصيات مع إدارة المخاطر
تقدم لوحة "النصائح":
الدخول المقترح
وقف خسارة فني
هدفان لجني الأرباح
هيكل التأرجح (شراء أو بيع)
سياق العملية
👉 إنها ليست مجرد تحليل.
👉 إنها خطة منظمة.
🏆 لمن هذا المؤشر؟
✔ المتداولون المبتدئون الذين يحتاجون إلى وضوح
✔ المتداولون المتوسطون الذين يرغبون في التقاء
✔ المتداولون المتقدمون الباحثون عن الكفاءة
✔ متداولو التأرجح
✔ المتداولون السريعون الذين يستخدمون التأكيد الهيكلي
💎 لماذا يبرز في السوق؟ المؤشرات الشائعة تحليل سمارت تك
معلومات معزولة تحليل متكامل تلوث بصري لوحة منظمة لا سياق تقني التقاء لا إدارة وقف وهدف مقترح إشارات بسيطة إشارات مع تأكيد
📊 الفوائد المباشرة
✔ يقلل من القرارات العاطفية
✔ يزيد من الدقة
✔ يحسن القراءة الهيكلية
✔ يوفر الوقت
✔ يرفع المستوى المهني للمتداول
🧠 تحديد موقع السوق
تحليل سمارت تك مثالي لـ:
سوق الفوركس
المؤشرات
السلع
العملات الرقمية


![شعار "Smart Money Concepts (SMC) [Iridio Capital]"](https://cdn.ctrader.com/image/webp/28b69fd1-ef54-4bed-9487-07e78e883be4_40934)


![شعار "Gaussian Channel [Iridio Capital]"](https://cdn.ctrader.com/image/webp/7c039209-5573-4a54-a072-f9528b503103_41960)
![شعار "[Stellar Strategies] Market Session Ultimate"](https://cdn.ctrader.com/image/webp/61ffd537-0125-4246-9e72-42eca1791d64_28232)


