
الوصف
موجة حرارة زخم KST — تحويل الزخم إلى درجة حرارة السوق (على الرسم البياني)
✅ محرك KST الحديث مع الإعدادات الافتراضية المحسنة (10/15/20/30 + 10/10/10/15، إشارة 9)
✅ تراكب السعر الحقيقي — يتم عرض KST + الإشارة مباشرة على الرسم البياني حول EMA الأساسي
✅ 4 أوضاع بصرية: Pro Smooth / كلاسيكي / حرارة خام / مستويين
✅ خريطة حرارة الزخم + توهج لتصور القوة فوراً
✅ قوة الزخم المعممة للاتساق عبر الرموز والفترات الزمنية
✅ نظام هستيريسيس مضاد للتقلبات لتصفية الضوضاء في الأسواق الجانبية
هذا ليس مذبذبًا تقليديًا.
موجة حرارة زخم KST تحول مؤشر Know Sure Thing (KST) الكلاسيكي إلى نظام درجة حرارة زخم بصري مدمج مباشرة على الرسم البياني الخاص بك.
بدلاً من مشاهدة مذبذب أسفل الرسم البياني، يصبح الزخم طبقة ديناميكية فوق السعر — تظهر الاتجاه والقوة ودورة حياة الزخم بطريقة يمكن تفسيرها فوراً.
ما يفعله المؤشر وما هو مصمم له
موجة حرارة زخم KST يحول بيانات الزخم إلى خريطة حرارة بصرية لضغط السوق.
تتطلب المذبذبات التقليدية من المتداولين التبديل المستمر بين مخطط السعر ونافذة المؤشر المنفصلة.
يزيل هذا المؤشر هذا الاحتكاك من خلال عرض الزخم مباشرة على مخطط السعر نفسه.
النتيجة هي سير عمل أنظف حيث يمكنك رؤية فوراً:
- متى يكون الزخم يتسارع
- متى يكون الاتجاه قويًا ومهيمنًا
- متى يكون الزخم يبرد
- متى يدخل السوق في تقلب منخفض الطاقة
تم تصميمه للمتداولين الذين يرغبون في التعرف بسرعة على:
- قوة الاتجاه
- فرص استمرار الزخم
- نفاد الزخم
- تغيرات النظام
بدلاً من التخمين ما إذا كانت الحركة مدعومة بقوة، تجعل موجة حرارة زخم KST ذلك الضغط مرئيًا.
ما يرسمه على الرسم البياني وكيفية قراءته
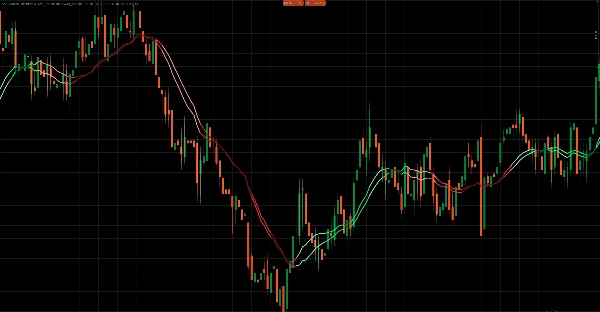
يرسم المؤشر خطين للزخم مباشرة على مخطط السعر، مع طبقة حرارة بصرية.
1. خط KST — جوهر الزخم
خط الزخم الرئيسي المحسوب من أربعة مكونات ROC موزونة.
التفسير:
- KST فوق الإشارة → زخم صاعد
- KST تحت الإشارة → زخم هابط
المسافة بين الخطين تشير إلى شدة الزخم.
2. خط الإشارة — مشغل الزخم
متوسط متحرك مملس لخط KST.
يعمل كـ خط مشغل الزخم.
- التقاطع بين KST والإشارة غالبًا ما يشير إلى تغيرات أو تسارعات في الزخم.
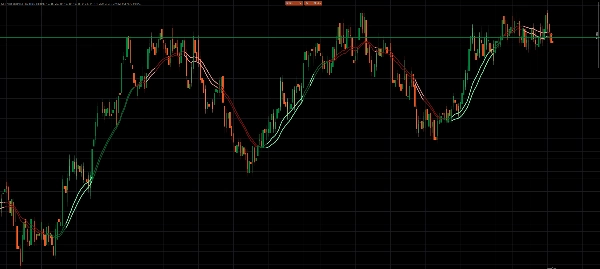
3. طبقة حرارة الزخم
يحول المؤشر المسافة بين KST والإشارة إلى قيمة قوة معممة بين 0 و 1.
تتحكم هذه القيمة في شدة اللون وتصوير خريطة الحرارة.
التفسير:
- الألوان الفاتحة/المشرقة → زخم قوي
- الألوان العادية → ضغط اتجاه مستقر
- الألوان الداكنة → ضعف الزخم
- تلاشي الألوان → تباطؤ محتمل أو انتقال
تؤدي تأثيرات خريطة الحرارة والتوهج الاختيارية إلى تلوين الشموع نفسها، مما يسمح للمتداولين برؤية متى "يسخن" السوق فوراً.
4. طبقة إسقاط السعر
بدلاً من رسم قيم المذبذب الخام، يقوم المؤشر بإسقاط الزخم على السعر باستخدام:
- خط EMA الأساسي
- سعة مضبوطة بواسطة ATR
يحافظ هذا على تناسب التراكب مع الرسم البياني ويضمن بقاء المؤشر قابلاً للقراءة عبر الأسواق والفترات الزمنية المختلفة.
الأوضاع البصرية والسلوك
تتضمن موجة حرارة زخم KST أربعة أنماط بصرية تغير كيفية تفسير الزخم.
Pro Smooth
الوضع الأكثر تقدمًا.
الميزات:
- تلوين الزخم بناءً على دورة الحياة
- تصفية هستيريسيس
- متطلبات تأكيد قبل تغير الاتجاه
يقلل هذا بشكل كبير من الضوضاء خلال الأسواق الجانبية أو المتقلبة.
كلاسيكي
يستخدم تلوين دورة الحياة بدون تصفية هستيريسيس.
النتيجة:
- استجابات زخم أسرع
- أكثر حساسية قليلاً لتقلبات السوق
مناسب بشكل أفضل لـ التداول اليومي والتأرجحي.
الحرارة الخام
يركز فقط على قوة الزخم المطلقة.
يصنف الزخم إلى ثلاث مستويات:
- قوي
- متوسط
- ضعيف
هذا الوضع مثالي للمتداولين الذين يريدون قراءة نقية لقوة الزخم.
مستويين
وضع تفسير مبسط.
- KST فوق/تحت الإشارة يحدد الاتجاه
- حد قوة يحدد الزخم القوي مقابل الضعيف
مصمم للمتداولين الذين يفضلون تعقيد بصري بسيط.
كيفية استخدام موجة حرارة زخم KST
الخطوة 1 — اختر وضعك البصري
استخدم الوضع الذي يتناسب مع أسلوب تداولك:
- Pro Smooth → أنظف الإشارات في الأسواق المزعجة
- كلاسيكي → ردود أسرع
- الحرارة الخام → تركيز على قوة الزخم
- مستويين → تفسير بسيط للزخم القوي مقابل الضعيف
الخطوة 2 — تحديد نظام الزخم
ابحث عن سلوك اللون السائد:
- سيطرة الألوان الصاعدة → ميل للشراء
- سيطرة الألوان الهابطة → ميل للبيع
- تلاشي الألوان الداكنة → ضعف الزخم
- تغيرات متكررة في اللون → على الأرجح ظروف تداول جانبية
الخطوة 3 — استخدم الزخم لتوقيت التداول
تشمل حالات الاستخدام النموذجية:
استمرار الاتجاه
ادخل أثناء التراجعات عندما يظل نظام الزخم سليمًا وتبقى القوة مرتفعة.
نفاد الزخم
قلل التعرض عندما تتلاشى الألوان إلى الأغمق وتنخفض القوة.
انعكاس الزخم
راقب تقلبات KST/الإشارة مع ارتفاع القوة.
مثال على إعداد موصى به
تكوين متوازن لمعظم الأسواق:
الإعداد المسبق: Swing_Classic
الوضع البصري: Pro Smooth
EMA الأساسي: 34
فترة ATR: 14
سعة ATR: 1.40
تطبيع فترة النظر للخلف: 200
خريطة الحرارة: مفعلة
التوهج: مفعل
الأسواق والفترات الزمنية الموصى بها
نظرًا لأن المؤشر يستخدم مقياس ATR والقوة المعممة، فإنه يتكيف جيدًا مع معظم الأسواق.
يعمل بشكل جيد بشكل خاص على:
الفوركس
- M5 – H1 للتداول اليومي
- H1 – H4 للتداول التأرجحي
المؤشرات
- M1 – M15 للسكالبينج الزخمي
- M15 – H1 للتداول الاتجاهي المنظم
العملات الرقمية
- M5 – H1 (يوصى بـ Pro Smooth)
- H1 – H4 لبيئات الاتجاه
السلع
- M15 – H4
تستفيد الفترات الزمنية الأقل من تصفية Pro Smooth.
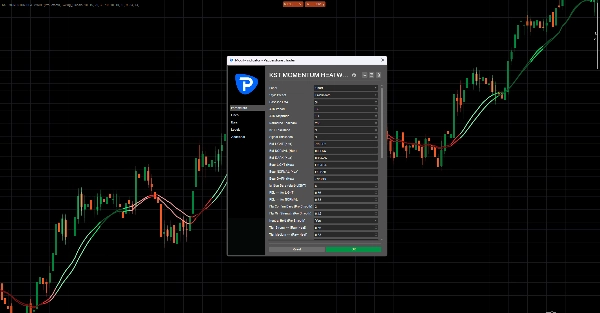
المعلمات الرئيسية وما تتحكم به
نظام الإعدادات المسبقة
تقوم الإعدادات المسبقة Scalp_Clean و Swing_Classic و Smooth و Aggressive بضبط تكوين KST الداخلي.
الوضع المخصص يسمح بالتحكم اليدوي الكامل.
تطبيع الزخم
تطبيع فترة النظر للخلف
يتحكم في النافذة التاريخية المستخدمة لمقياس قوة الزخم.
القيم الأعلى تنتج قراءات أكثر سلاسة.
إسقاط التراكب
EMA الأساسي
يحدد خط الارتكاز المستخدم لإسقاط تراكب الزخم.
سعة ATR
يتحكم في مدى توسع التراكب من الخط الأساسي.
ضوابط مضادة للتقلب (Pro Smooth)
أشرطة تأكيد التقلب
عدد الأشرطة المطلوبة لتأكيد تغير النظام.
الحد الأدنى لقوة التقلب
الحد الأدنى لقوة الزخم المطلوبة قبل قبول التقلب.
الاحتفاظ المحايد
يساعد في استقرار النظام خلال ظروف الزخم الضعيف.
تصوير الحرارة والتوهج
يتحكم في مدى استجابة خريطة الحرارة لقوة الزخم.
تشمل المعلمات:
- عرض الحرارة
- ألفا الحرارة
- جاما الحرارة
- قوة التوهج
إدارة الأداء
الاحتفاظ بالأشرطة
يحدد عدد الكائنات البصرية التي تبقى على الرسم البياني للحفاظ على تشغيل المؤشر بسلاسة.
ملاحظات مهمة
شدة كائنات الرسم البياني
تؤدي تأثيرات خريطة الحرارة والتوهج إلى رسم عدة كائنات.
إذا تباطأ الأداء:
- قلل من قيمة KeepBars
- قلل من عرض الحرارة
- عطل التوهج
تشبع القوة
قد تدفع تقلبات شديدة القوة القوة إلى أقصى حد بسرعة.
إذا حدث ذلك:
- زد تطبيع فترة النظر للخلف
- انتقل إلى وضع Pro Smooth
الأفضل استخدامه مع الهيكل
تم تصميم موجة حرارة زخم KST كـ طبقة نظام زخم، وليس كمولد دخول مستقل.
لأفضل النتائج، اجمعه مع:
- الدعم والمقاومة
- هيكل السوق
- مناطق السيولة
- تحليل الاتجاه


