present
Zarejestruj się i otrzymaj 50 $ zniżki na pierwszy zakup
Trading product for AW Multi Data Wskaźnik, image 1
AW Multi Data
5.62K
Bezpłatne instalacje

Opis

Podsumowanie

Podsumowanie AI
AW Multi Data is a trading indicator that displays key trading metrics directly on your chart. It shows the current symbol and timeframe, daily net profit percentage, daily net profit amount, and spread. The indicator requires the timezone to be set to UTC to accurately reflect daily profit values. This tool provides real-time performance data to assist traders in monitoring their trades within the charting interface.
Profil wskaźnika

Dyskusja

Opinie klientów

0.0
Opinie: 0
Opinie klientów
Ten produkt nie ma jeszcze opinii. Wypróbowałeś(-aś) go już? Bądź pierwszy(-a) i powiedz o tym innym!

Częste pytania

Produkty dostępne za pośrednictwem cTrader Store, w tym boty handlowe, wskaźniki i wtyczki, dostarczane są przez deweloperów zewnętrznych i udostępniane wyłącznie w celach informacyjnych oraz w celu zapewnienia dostępu technicznego. cTrader Store nie jest brokerem i nie zapewnia doradztwa inwestycyjnego, nie udziela spersonalizowanych rekomendacji ani nie gwarantuje przyszłych wyników.

Więcej od tego autora

Logo „IR Candle MTF”
4.6
(6)
Za darmo
with this indicator you could see other time frame candle in your chart.
show spread on chart
some user add moving average to macd to see better. in ctrader 4.3.11 there is a problem with this . I make a macd tha
this indicator show macd on chart.
Multi Time Frame Moving Average is a powerful and flexible indicator for cTrader
 this moving include everything that a trader needs from Moving Average.
this indicaotr show distance between Tenkan to Kijun, Close to Kijun and Close to Tenkan 
Add Slowing to IR Moving Average.
IR Candle Open plots customizable opening price lines for daily, weekly, and monthly candles
Coral indicator
you could put your check list in your chart you could split your test with “,” you could put your checklist in indicat
this indicator show other time frame close in lower time frame. for ex: show daily close in m 15.

Możesz także polubić

View tick activity across a selected chart range with Point of Control, Value Area High and Value Area Low.
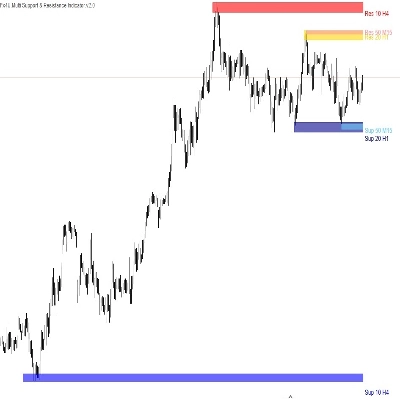
Allow trader to visualize Support & Resistance across different timeframes,give trader an overview of the current market
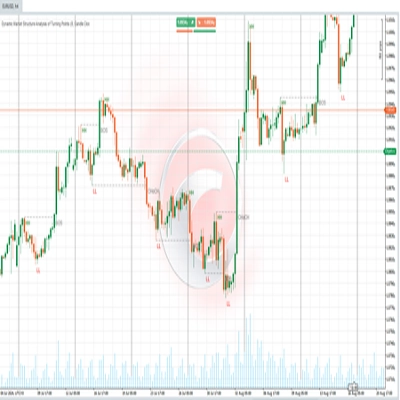
Identify market structure effortlessly with swing highs, lows, CHoCH, and BOS levels for smart trading decisions! 📊🔍"
Trade fearlessly: auto-adjusts order blocks, manages risks, and ensures precision. Was Free for early users now -80%
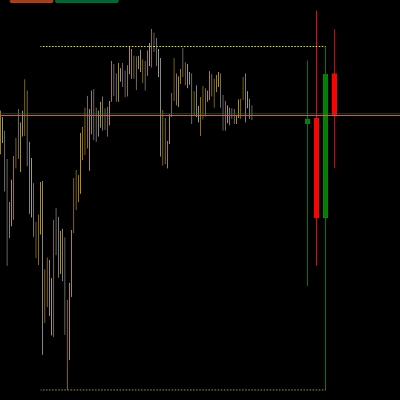
The Multi-Timeframe Candle Indicator displays candles from multiple timeframes in one window, enhancing market analysis!
Logo „Candlehtf”
4.2
(4)
$19
/
$20
MultiFrameCandles para cTrader: La Herramienta Definitiva para Dominar Cualquier Marco de Tiempo
Opening ranges, dynamic trend channels, and multi-scale breakout/retest analysis for clear intraday chart decisions.
Free chart-overlay indicator for confirmed BOS, CHoCH and ATR-filtered Fair Value Gap analysis.
RSI bands drawn on price, confluence-scored BUY/SELL signals, an ATR stop with three targets
This is the trial version of Time To Break Even, which help you time your trade entry.
John Ehlers' trendline using signal processing to filter cycle noise and identify trends with minimal lag.
🚀 HALF TREND Indicator - The Ultimate Trend Following System 🚀
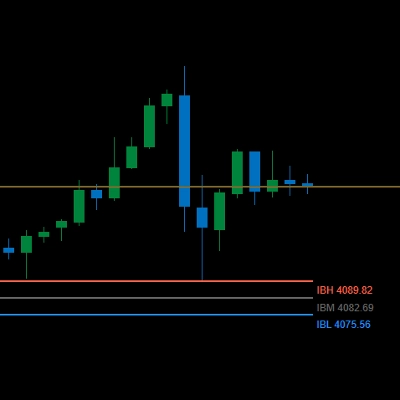
Basic & FREE. Plots New York Initial Balance (NY local time) and projects IB High, IB Low, and midline.
Customize the MACD! Choose colors, get real-time tick updates, and see crossover points for enhanced trading precision.
RSI on the main chart with 45/55 momentum levels, overbought/oversold levels, averaged RSI, and multi-timeframe support.
Overbought Oversold Indicator
Unlock trading precision with QQE! Dual QQE indicators with a Bollinger Bands zero line provide clear buy/sell signals.
Trend-following channel using dual MAs with visual cloud and optional alerts on crossovers

Cena

5.62K
Bezpłatne instalacje