

present
Registrati e ricevi uno sconto da $50 sul tuo primo acquisto
Trading product for RSI Overlay Indicatore RSI, image 1
RSI Overlay
Indicatore
Versione 1.1, Oct 2026
Windows, Mac
Trading product for RSI Overlay Indicatore RSI, image 2
Trading product for RSI Overlay Indicatore RSI, image 3
Trading product for RSI Overlay Indicatore RSI, image 4
Trading product for RSI Overlay Indicatore RSI, image 5
Trading product for RSI Overlay Indicatore RSI, image 6
Trading product for RSI Overlay Indicatore RSI, image 7
Da 28/01/2026
4
Vendite

Descrizione

THE IDEA

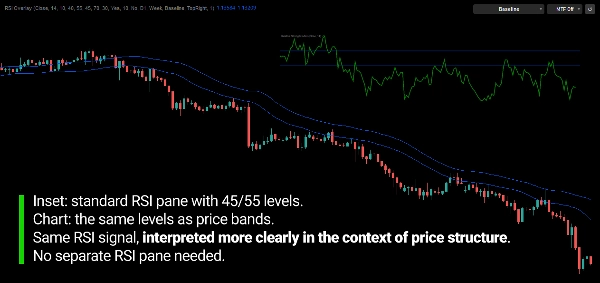
An RSI that translates oscillator levels into price levels and plots them directly on the price chart instead of reading RSI in a separate pane to keep momentum and price in the same space.


THE PROBLEM

RSI is normally read in a separate pane.

To use it, you must constantly compare an oscillator value with what price is doing on the main chart.

But analysis happens on the price chart.

Levels such as 70, 30, or 50 are numbers on an oscillator. They do not tell you where price needs to be for RSI to reach them.

So you keep translating by eye: "RSI is at 62 — where is that on the chart?"

The problem is not RSI itself.

The problem is that momentum and price are shown in two different places, in two different units.


THE CORE CONCEPT: RSI LEVELS BECOME PRICE LEVELS.

Traditional RSI asks:

"What is the RSI value right now?"

RSI Overlay asks:

"At what price would RSI reach this level?"

Each RSI reference is converted into the corresponding price level and plotted directly on the chart.

The oscillator is no longer something you have to read in one window and translate into another.

Its information is expressed in the same price scale as the movement you are already analyzing

The RSI sets the level. The chart shows it in price.


WHAT IT DOES

RSI Overlay converts selected RSI references into dynamic price levels and displays them directly on the main chart.

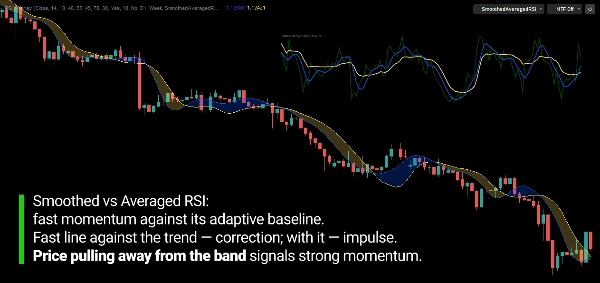
Bullish and bearish RSI levels, Overbought and Oversold levels, and two RSI-based references — Smoothed RSI and Averaged RSI — are all represented as price lines.

The lines update with each new bar, so they continue to represent the current RSI calculation rather than remaining fixed at a historical price.

These are not conventional support or resistance levels.

They represent the price at which the corresponding RSI value would be reached under the current RSI calculation.

The indicator does not try to predict where price will go.

It shows where price stands relative to the RSI levels you are observing.


HOW IT WORKS

  1. RSI is calculated using Wilder's smoothing.
  2. Each RSI level is converted into the price that would produce it.
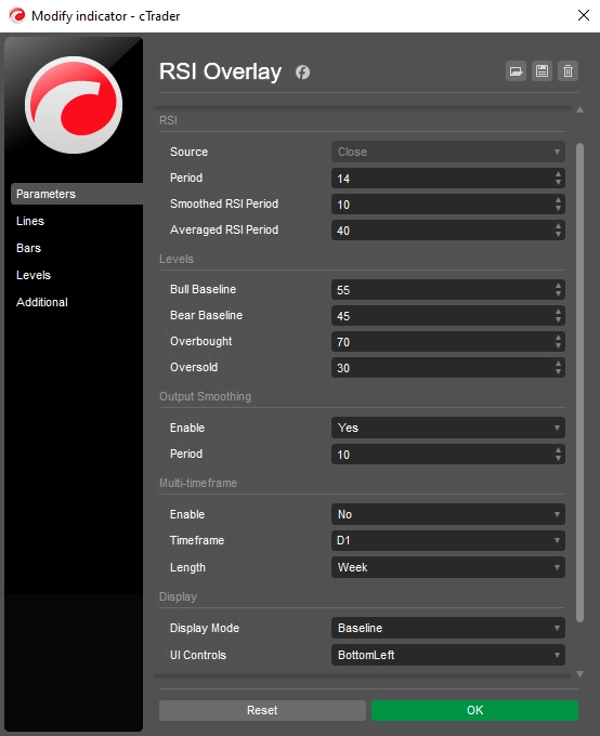
  3. Bullish and bearish RSI levels (Bull and Bear Baselines) mark the momentum zone around the centerline (default 55 / 45).
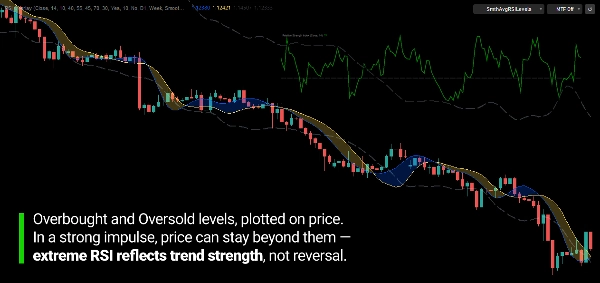
  4. Overbought and Oversold levels are converted the same way (default 70 / 30).
  5. Smoothed RSI and Averaged RSI are converted into price lines as well.
  6. All references update bar by bar as the RSI calculation develops.

The result is an RSI framework expressed entirely in price terms.


THE RSI REFERENCES

Bull / Bear Baselines
The price levels at which RSI would enter bullish or bearish momentum territory. The space between them shows where momentum is neutral.

Smoothed RSI
A noise-reduced version of RSI, shown as a price line that reacts more smoothly.

Averaged RSI
A slower, adaptive average of RSI, shown as a price line. It provides a steadier momentum reference.

Overbought / Oversold
The price levels at which RSI would reach the overbought and oversold thresholds.

These references are not automatic signals.

Their position relative to price, and to each other, provides context about how momentum is developing.


MULTI-TIMEFRAME CONTEXT

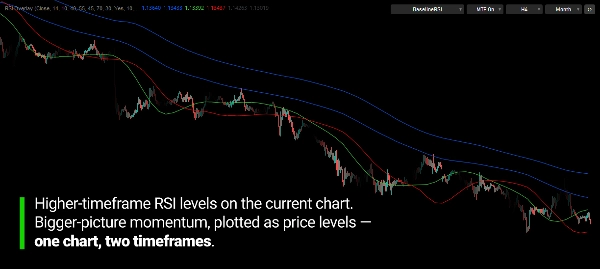
The RSI does not have to come from the chart timeframe you are viewing.

For example, a Weekly or Monthly RSI can be projected onto an H1 chart.

This places the higher-timeframe momentum framework directly on the price action you are watching.

You choose how much history is drawn, from the last hour up to several years.

The selected timeframe must be higher than the chart timeframe.


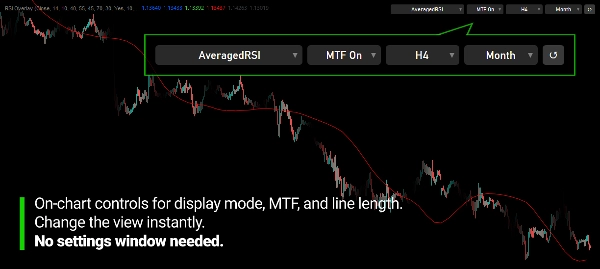
CONTROL IT FROM THE CHART

Eleven display modes let you show only what you need, from a clean pair of baselines to the full set of RSI references.

A compact control bar on the chart lets you switch display mode, turn multi-timeframe on or off, and change timeframe and length without reopening the settings.

A reset button returns everything to your starting parameters.

The bar can be placed in any corner or hidden.


WHAT YOU CAN OBSERVE

The indicator is designed to make several things visible:

  • Where price stands relative to bullish and bearish momentum zones
  • How far price is from overbought and oversold levels, in price terms
  • Momentum shifts around the baselines
  • Pullbacks and continuation relative to the smoothed and averaged RSI
  • Higher-timeframe momentum context on a lower-timeframe chart

RSI Overlay is a measurement tool, not a standalone buy/sell system.


BUILT FOR MOMENTUM IN PRICE TERMS

The purpose is not to replace RSI.

It is to remove the need to translate an oscillator back into price by eye.

Everything you know about RSI still applies. It is simply shown where decisions are actually made: on the price chart.


KEY FEATURES

  • RSI levels converted into price levels on the main chart
  • Bullish and bearish RSI levels (default 55 / 45)
  • Overbought and Oversold price levels (default 70 / 30)
  • Smoothed RSI line
  • Averaged RSI line
  • Multi-timeframe RSI on lower-timeframe charts
  • Selectable display length for multi-timeframe lines
  • 11 display modes
  • On-chart control bar with reset
  • Configurable source, RSI period, smoothing and averaging
  • Customizable colors, line styles and thickness


---


Trading involves risk. This indicator is a technical analysis tool and should be used together with appropriate risk management.

Riepilogo

Riepilogo AI
RSI Overlay is a technical indicator that projects Relative Strength Index (RSI) levels directly onto the main price chart by converting oscillator values into corresponding price levels. This approach integrates momentum and price analysis within a single chart space, eliminating the need to interpret RSI in a separate pane. The indicator calculates RSI using Wilder's smoothing method and translates key RSI references—such as bullish and bearish momentum baselines (default 55/45), overbought/oversold thresholds (default 70/30), smoothed RSI, and averaged RSI—into dynamic price lines that update with each new bar.

It supports multi-timeframe analysis by allowing RSI data from higher timeframes (e.g., weekly or monthly) to be displayed on lower timeframe charts, providing broader momentum context. Users can customize display modes, line styles, colors, and control parameters directly from an on-chart control bar, which includes options to reset settings and adjust timeframe and length without reopening menus.

RSI Overlay serves as a measurement tool to visualize where price stands relative to momentum zones and RSI thresholds in price terms. It does not generate automatic trading signals but aids in observing momentum shifts, pullbacks, and continuations aligned with RSI levels on the price chart.
Profilo indicatore

Recensioni dei clienti

0.0
Recensioni: 0
Recensioni dei clienti
Questo prodotto non ha ancora ricevuto recensioni. L'hai già provato? Fallo sapere agli altri per primo!

Discussioni

Domande frequenti

RSI
I prodotti disponibili tramite cTrader Store, inclusi bot di trading, indicatori e plugin, sono forniti da sviluppatori terzi e resi disponibili esclusivamente a scopo informativo e di accesso tecnico. cTrader Store non è un broker e non fornisce consulenze in materia di investimento, raccomandazioni individualizzate o garanzie di risultati futuri.

Altro da questo autore

Indicatore
Supertrend
Moving Average
Adaptive MA anchored to structural trend changes — no fixed period. Dual Supertrend + swing detection.
Indicatore
Fibonacci
Auto-swing detection driving 7 Fibonacci projections: retracement, expansion, fan, time, pitchfork, channel, Gann.
Indicatore
EMA
SMA
+2
Drag MA to any swing point — MA anchors and recalculates instantly. Not period-based. Structural.
Indicatore
Channel
Fibonacci
Anchor-based Fibonacci channel that grows with the market. Seven display modes, auto-direction, fully draggable.
Indicatore
Volume
Custom range volume profile between two draggable anchors. Auto source timeframe, Total/Up-Down/Delta, POC, Value Area.

Potrebbe interessarti anche

Indicatore
SMC
Forex
+7
Simple Smart Money Concepts (SMC)
Indicatore
Forex
Flexible Volume Profile, designed with performance in mind.
Logo di "vwap"
Popolare
4.8
(5)
$26
Indicatore
VWAP
Forex
+2
Custom VWAP Indicator for cTrader
Indicatore
Volume
Imbalance
+1
Volume profile indicator that auto-detects the latest trendline. Shows POC, Value Area (VAH/VAL), and High Volume Nodes
Indicatore
RSI
Forex
+4
😎Read the description before purchasing💩
Indicatore
Channel
Imbalance
+2
Adaptive volatility channel based on moving average and standard deviation (σ).
Indicatore
Forex
Crypto
+3
Consecutive Series Moves — Reveal the True Pulse of Price Action
Indicatore
ADX
ATR
+1
Indicador de Sinais Visuais para Spotcrude (WTI) ou SpotBrent com filtros de tendência, operacional de 10 e 15 minutos.
Indicatore
RSI
Forex
+6
What Constance Brown did with the RSI was to input a momentum calculation within the RSI itself. This the Composite RSI.
Indicatore
Pin Bar
Inside Bar
+2
Advanced candlestick pattern recognition with structural quality scoring, alerts and adaptive chart visuals.
Indicatore
Prop
Forex
+4
HMA MTF 2.0 (Multi-Timeframe )
Logo di "IVB 2.0"
Più votato
4.6
(5)
$19
Indicatore
IVB 2.0 is an indicator that works on the strategy of imbalance of the maximum volatility box of indices
Indicatore
BOS
MSS
+3
Advanced indicator to highlight key execution context and help aligning structure, location, and risk.
Indicatore
Market Sessions
Indicatore
Forex
BTCUSD
+5
Simple ICT Concepts
Indicatore
BOS
MSS
+5
Your entire ICT session map, structure engine, and key levels — No manual work. One indicator. Every session!
Indicatore
ADX
ATR
+5
Signal Quality Score - 0-100 filter combining RSI, Volume, ATR, Trend Strength & Alignment. Works on ANY chart type.
Indicatore
This indicator is a valuable tool for traders looking to identify significant opening price level of any asset.

Prezzo

Da 28/01/2026
4
Vendite






















