
CursorByte.SupportResistance v3
مؤشر
292 التنزيلات
الإصدار 1.0، Mar 2025
Windows, Mac
5.0
التقييمات: 1
الوصف
***نسخة محسنة***
https://ctrader.com/products/2113
***********************
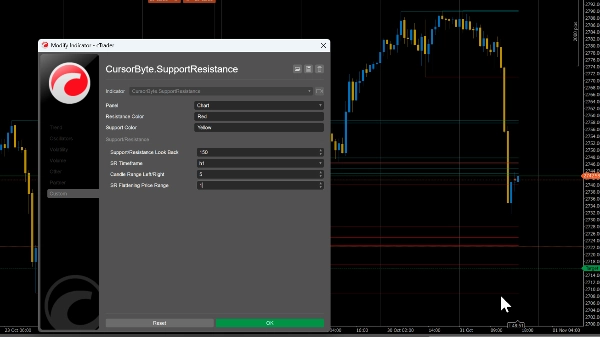
يمكنك تعيين نطاق تسوية السعر بناءً على الزوج. إما 0.0001 للأزواج مثل GU و 1.5 للذهب.
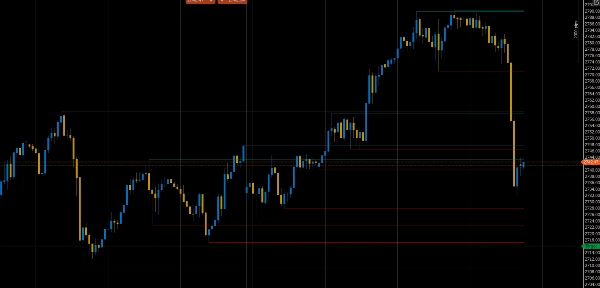
يقوم هذا المؤشر تلقائيًا بتحديد مستويات الدعم والمقاومة الرئيسية على الرسم البياني، مما يساعد المتداولين على تحديد مناطق الانعكاس المحتملة، ونقاط الاختراق، ومناطق تجميع الأسعار لاتخاذ قرارات دخول وخروج أفضل.
ملاحظة: استخدم نطاق تسوية السعر لتقليل الفوضى على الرسم البياني (تجميع خطوط الدعم والمقاومة ضمن نطاق سعري معين في واحد).
الملخص
ملف تعريف المؤشر
تقييمات العملاء
5.0
التقييمات: 1
5 | 100 % | |
4 | 0 % | |
3 | 0 % | |
2 | 0 % | |
1 | 0 % |
تقييمات العملاء
August 12, 2025
Pros: Accurate auto SR levels, customizable design, stable performance. Cons: No significance filter, no auto-clear, possible chart clutter.
مناقشة
الأسئلة الشائعة
Breakout
Commodities
XAUUSD
يتم توفير المنتجات المتاحة من خلال cTrader Store، بما في ذلك روبوتات التداول والمؤشرات والإضافات، من قبل مطوري الطرف الثالث وإتاحتها لأغراض الوصول المعلوماتي والفني فقط. cTrader Store ليس وسيطًا ولا يقدم نصائح استثمارية أو توصيات شخصية أو أي ضمان للأداء المستقبلي.


قد يعجبك أيضًا


السعر
منذ 31/10/2024
56
المبيعات
1.74K
التثبيتات المجانية