
Beschreibung
- Was es tut (sein Wert).
- Wie es Händlern hilft.
- Was es einzigartig macht.
- Wie man es benutzt (kurz).
- Was die kostenpflichtige Version freischalten wird (Vorschau).
🔸
Session Golden Hours Indikator
(Kostenlose Version)
Beschreibung
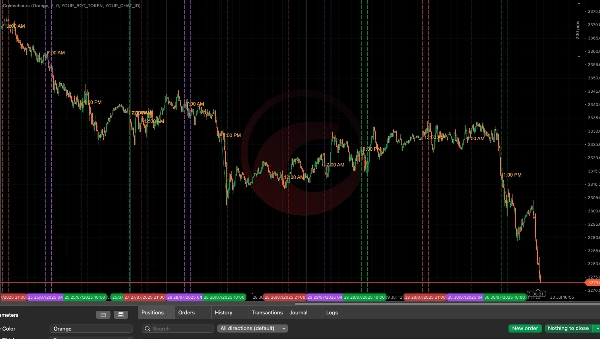
Der Session Golden Hours Indikator ist für ernsthafte Händler konzipiert, die hochwahrscheinliche Handelsfenster basierend auf sessionsbasierten Liquiditätsmustern visualisieren möchten. Dieses Tool hebt automatisch wichtige Zeiträume während der Asia-, London- und New York-Sessions hervor – oft als die „goldenen Stunden“ des Marktes bezeichnet – in denen der Preis am wahrscheinlichsten aus der Spanne ausbricht und institutionelle Absichten offenbart.
Was es tut:
- Verfolgt Hochs/Tiefs der Asia-Session (00:00–08:00 UTC) zur Abbildung von Liquiditätszonen.
- Hebt wichtige Stunden von London und New York hervor wie:
-
- London Pre-Close (06:00–07:00 UTC)
- London Close Hour (07:00–08:00 UTC)
- NY Afternoon Sweep Zone (13:00–14:00 UTC)
- Zeichnet visuelle Hilfen in Ihrem Chart, um Ihre Aufmerksamkeit auf die täglichen Ausbruchsstunden zu lenken.
Wie es Ihnen hilft:
- Erkennen Sie leicht Liquiditäts-Sweep-Zonen während Session-Überlappungen.
- Konzentrieren Sie Ihre Handelsentscheidungen auf Smart-Money-Zeiträume — kein Handel mehr in toten Zonen.
- Erkennen Sie visuell, wo häufig Fehlausbrüche und Umkehrungen auftreten.
- Funktioniert über jedes Instrument und jeden Zeitrahmen , der globalen Session-Zyklen folgt.
Hauptmerkmale:
- Anpassbare Linienfarbe, Dicke und Zeitausdehnungen.
- Automatische Session-Verfolgung ohne manuelles Plotten.
- Eingebaute Unterstützung für die letzten 15 Handelstage.
- Saubere, nicht aufdringliche Chart-Visualisierungen.
Ideal für:
- ICT-Stil Händler (Liquiditäts- + Timing-Modelle)
- Price Action Scalper
- Händler, die zeitbasierte Konfluenz nutzen
🔓 Mehr gewünscht?
Die Pro-Version (bald verfügbar) bietet zusätzlich:
- Echtzeit-Ausbruchwarnungen direkt gesendet an Telegram
- Logik für Asia Fehlausbrüche → London Umkehrungen und London Hochs/Tiefs → NY Umkehrungen
- Intelligenter Cooldown-Timer zur Vermeidung von Überwarnungen
- Vollständige Verfolgung von sessionsbasierten Hochs/Tiefs mit Signalbeschriftung
- Zukünftige Roadmap: FVG-Warnungen, interne Liquiditätszonen und Signalfilterung
Zusammenfassung
Kundenbewertungen
5 | 0 % | |
4 | 100 % | |
3 | 0 % | |
2 | 0 % | |
1 | 0 % |


