Descrizione
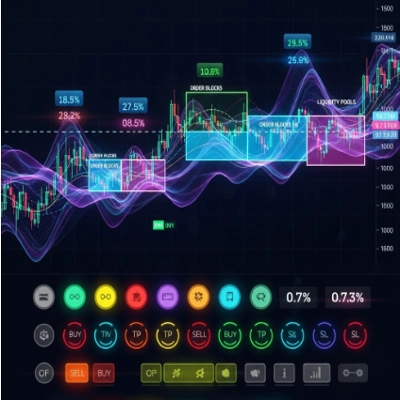
L'indicatore BLOCK LIQUIDITY combina due approcci principali all'analisi di mercato:
Rilevamento degli Order Block:
Identifica aree di supporto e resistenza basate su massimi e minimi non infranti all'interno di un periodo di lookback.
Genera segnali di acquisto quando il prezzo chiude sopra un minimo non infranto.
Genera segnali di vendita quando il prezzo chiude sotto un massimo non infranto.
Analisi della Liquidità:
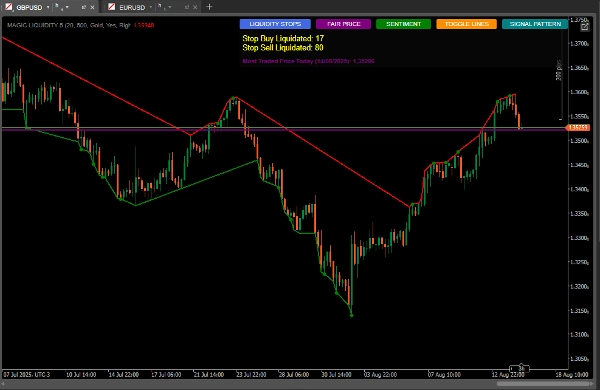
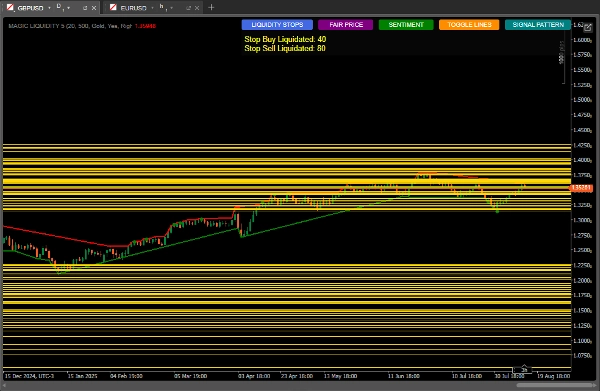
Rileva pool di liquidità (aree dove potrebbero essere concentrati gli stop loss).
Monitora l'attivazione degli stop di acquisto e vendita.
Calcola il sentiment di mercato basato sulla distribuzione della liquidità.
Identifica il prezzo più scambiato (prezzo equo).
Come Usare per Migliori Risultati
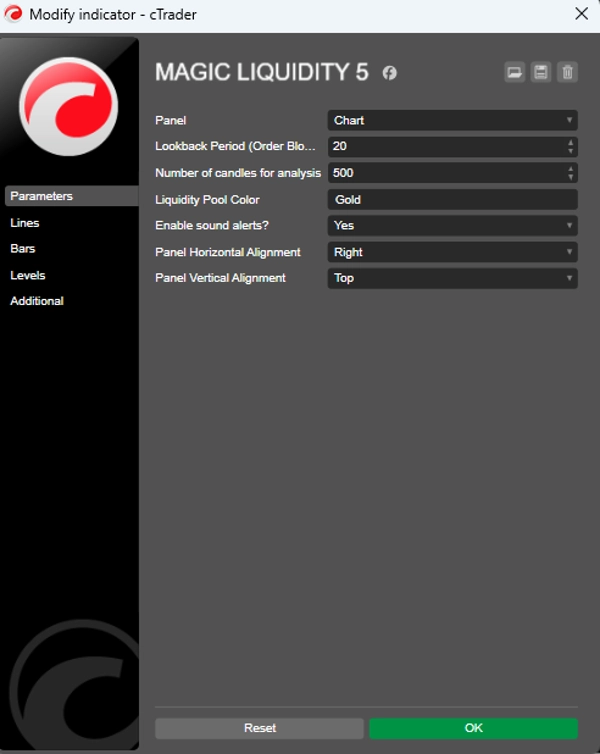
Configurazione Iniziale
Periodo di Lookback: Regola il parametro "Lookback Period" in base al timeframe su cui stai operando (valori più alti per timeframe più lunghi).
Numero di Candele per l'Analisi: Mantienilo a 500 per un'analisi robusta o riducilo per reazioni più rapide.
Colore del Pool di Liquidità: Scegli un colore che risalti sul tuo grafico.
Interpretazione dei Segnali
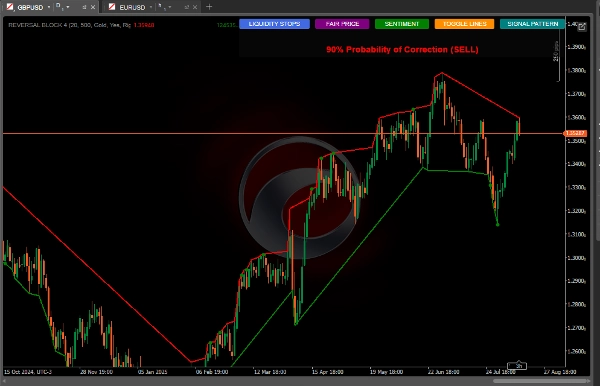
Segnali degli Order Block:
Punti verdi: segnali di acquisto quando il prezzo chiude sopra un minimo non infranto.
Punti rossi: segnali di vendita quando il prezzo chiude sotto un massimo non infranto.
Pool di Liquidità:
Linee orizzontali mostrano aree di liquidità (potenziali obiettivi o punti di inversione).
Monitora la relazione tra la liquidità sopra/sotto il prezzo attuale.
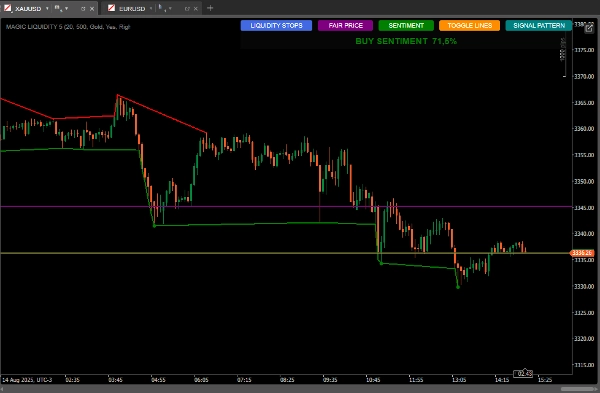
Sentiment di Mercato:
Usa il pulsante "SENTIMENT" per vedere la direzione prevalente e la fiducia.
Un sentiment di acquisto con alta fiducia suggerisce una crescita continua. Un sentiment di vendita con alta fiducia suggerisce una continuazione ribassista.
Pattern di Candele:
Il pulsante "SIGNAL PATTERN" analizza e
Mostra le probabilità di correzione basate sul rapporto quantitativo
Prezzo Più Scambiato (Prezzo Equo):
Il pulsante "FAIR PRICE" mostra il livello di prezzo con il volume più alto della giornata.
Può agire come una calamita per i prezzi o come supporto/resistenza.
Strategie di Utilizzo
Strategia Conservativa:
Operare solo quando i segnali degli order block coincidono con il sentiment prevalente.
Usa i pool di liquidità come obiettivi di take-profit.
Strategia Aggressiva:
Anticipa inversioni quando il prezzo si avvicina ai pool di liquidità con molti stop accumulati.
Usa le divergenze tra sentiment e azione del prezzo per operazioni controtrend.
Conferma Aggiuntiva:
Confronta con il pattern di candele mostrato dall'indicatore.
Verifica se il prezzo equo è nelle vicinanze come area di interesse.
Gestione del Rischio.
Stop-Loss:
Posiziona sotto l'order block più recente per gli acquisti
Posiziona sopra l'order block più recente per le vendite
Take-Profit:
Obiettivi nei pool di liquidità vicini
Considera il rapporto di liquidità sopra/sotto per impostare gli obiettivi
Consigli Avanzati
Usa il pulsante "TOGGLE LINES" per disabilitare le linee di liquidità quando il grafico diventa affollato
Monitora il conteggio degli stop liquidati per valutare la forza del movimento
Il prezzo equo è particolarmente utile nei mercati laterali come supporto/resistenza dinamico
Combina con altri indicatori per conferma (volume, medie mobili)
Volume indicatore:
https://ctrader.com/pt/products/635


