Beschreibung
Trend Scope Pro ist ein technischer Indikator auf professionellem Niveau, der Tradern ein tieferes Verständnis der Marktstruktur und der Kursrichtung vermitteln soll. Basierend auf fortschrittlichen linearen Regressionsalgorithmen berechnet dieses Tool eine dynamische Regressionslinie sowie drei Ebenen von Standardabweichungskanälen. Durch die Kombination statistischer Genauigkeit mit visueller Klarheit hilft es Ihnen, aktuelle Markttrends, potenzielle Umkehrzonen und Volatilitätsbereiche mühelos zu erkennen, was es zu einer zugänglichen und dennoch leistungsstarken Ergänzung für jedes Trading-Toolkit macht.
Wie man Trend Scope Pro liest
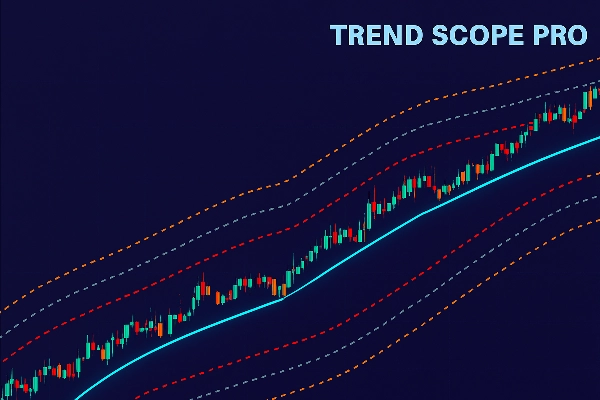
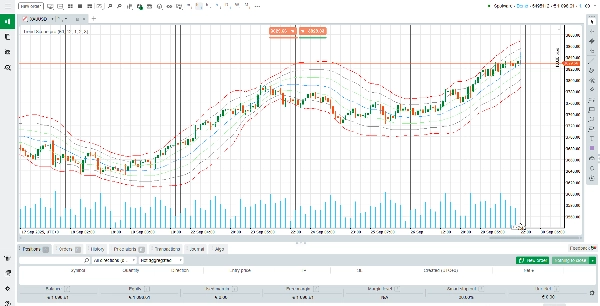
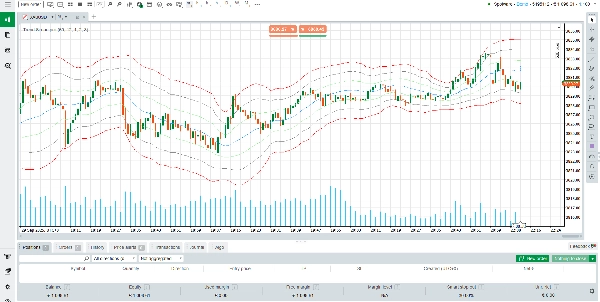
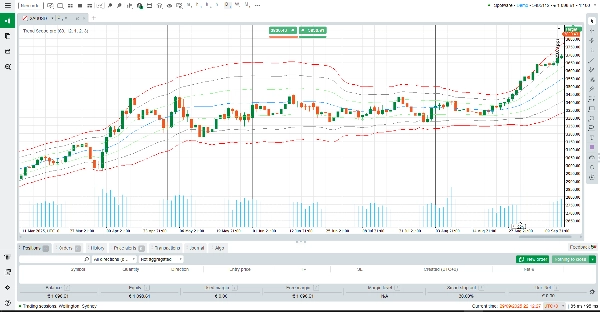
Wenn Trend Scope Pro auf Ihr Chart angewendet wird, zeichnet es eine zentrale Regressionslinie (blau), die den „fairen Wert“ oder die durchschnittliche Trendrichtung über einen definierten Zeitraum darstellt. Um diese Linie herum werden drei Sätze von oberen und unteren Kanälen gezeichnet (orange, grau und rot). Jeder Kanal wird mit einem anderen Standardabweichungs-Multiplikator berechnet:
Oben/Unten 1 (Orange): Repräsentiert die erste Standardabweichung. Kursbewegungen innerhalb dieser Zone spiegeln oft die normale kurzfristige Volatilität wider.
Oben/Unten 2 (Grau): Markiert stärkere Abweichungen. Das Erreichen dieser Zone signalisiert oft eine ausgedehnte Bewegung oder sich entwickelnde Dynamik.
Oben/Unten 3 (Rot): Extreme Zonen, in denen der Markt überkauft oder überverkauft sein kann, was potenzielle Umkehrmöglichkeiten schafft.
In der Praxis können Trader die Regressionslinie nutzen, um die Trendrichtung zu bestätigen, während die Kanäle als dynamische Unterstützungs- und Widerstandsebenen fungieren. Zum Beispiel:
Wenn der Kurs konsequent über der Regressionslinie bleibt, ist der Trend bullisch.
Wenn der Kurs wiederholt die Regressionslinie testet oder unterschreitet, schwächt sich der Trend ab.
Extreme Berührungen an den roten Kanälen können Erschöpfungspunkte hervorheben, an denen Umkehrungen oder Rücksetzer wahrscheinlicher sind.
Wie der Indikator funktioniert
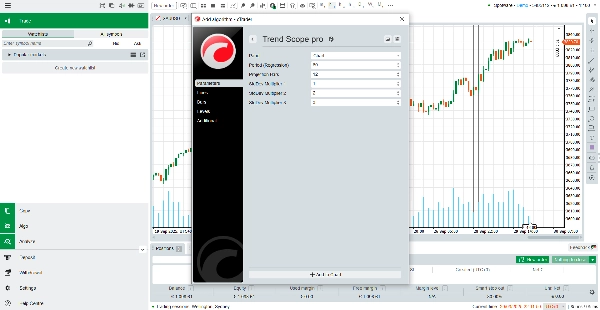
Trend Scope Pro berechnet eine Regressionslinie, indem es die Schlusskurse über einen gewählten Rückblickzeitraum analysiert. Anschließend misst es die Standardabweichung des Kurses von dieser Linie, was die Breite jedes Kanals bestimmt. Dieser statistische Ansatz stellt sicher, dass sich der Indikator an die Echtzeit-Volatilität anpasst und ein Gleichgewicht zwischen Trendfolgesignalen und Erkenntnissen zur Mittelwertumkehr bietet.
Die Standardeinstellungen (60 Balken Rückblick, Multiplikatoren 1,0, 2,0, 3,0) sind für die meisten Instrumente optimiert, können aber leicht an Ihre Strategie oder Ihren Zeitrahmen angepasst werden. Ob Sie ein Daytrader sind, der nach Intraday-Einstiegen sucht, oder ein Swing-Trader, der breitere Marktzyklen analysiert – Trend Scope Pro liefert verlässlichen Kontext für Ihre Entscheidungen.
Hauptmerkmale von Trend Scope Pro
Adaptive lineare Regression – Berechnet den zentralen Markttrend dynamisch für eine präzise Richtungsbestimmung.
Mehrstufige Kanäle – Drei Sätze von Abweichungsbändern helfen, normale Bewegungen, starke Trends und extreme Bedingungen zu identifizieren.
Visuelle Klarheit – Saubere und farbcodierte Linien erleichtern die Interpretation der Kursbewegungen auf einen Blick.
Anpassbare Einstellungen – Flexible Rückblickzeiträume und Abweichungsmultiplikatoren, die zu jedem Trading-Stil passen.
Zusammenfassend kombiniert Trend Scope Pro statistische Zuverlässigkeit mit praktischer Anwendbarkeit. Es ist mehr als nur eine Trendlinie – es ist ein vollständiges Rahmenwerk zur Analyse des Kursverhaltens, zur Identifikation von Zonen mit hoher Wahrscheinlichkeit und zur Verbesserung des Timings von Trades. Ob Sie eine Bestätigung des Trends suchen, Umkehrungen antizipieren oder einfach Struktur in Ihre Charts bringen möchten, Trend Scope Pro bietet die Klarheit und das Vertrauen, die Sie benötigen.
Zusammenfassung
Kundenbewertungen
5 | 50 % | |
4 | 50 % | |
3 | 0 % | |
2 | 0 % | |
1 | 0 % |


