Beschreibung
Tägliches TPO-Profil
Täglicher TPO-Profilindikator, der POC, VAH und VAL für jede Sitzung berechnet.
Zeichnet den Point of Control und den 70% Value Area direkt im Chart, um Ihnen zu helfen, faire Wertzonen, wichtige Unterstützungs-/Widerstandsniveaus und potenzielle Bereiche für Preisabweisung oder -akzeptanz zu identifizieren.
Wie es funktioniert
Dieser Indikator erstellt ein tägliches TPO (Time Price Opportunity) Profil, ähnlich einem Market Profile.
Für jeden Balken des Handelstages:
- teilt er die Preisskala in feste „Schritte“ auf, definiert durch „Row Size (Pips)“
- zählt er für jeden Preisschritt, wie viele Balken dieses Niveau berührt haben (TPO = wie oft der Preis dort gehandelt wurde)
- berechnet er am Ende des Tages:
-
- POC (Point of Control) → das Preisniveau mit der höchsten Anzahl an TPOs (wo der Markt die meiste Zeit verbracht hat)
- VAH (Value Area High) und VAL (Value Area Low) → die Preisniveaus, die ungefähr Value Area % (Standard 70%) aller TPOs für diese Sitzung enthalten
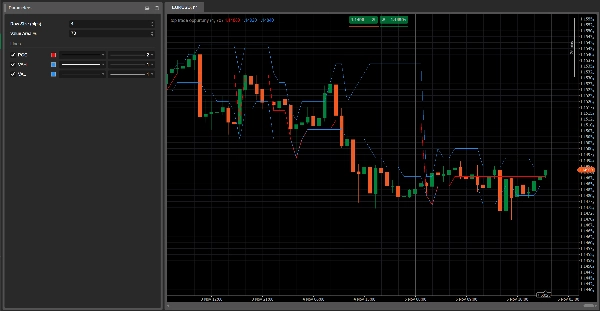
Der Indikator zeichnet drei horizontale Linien im Chart:
- Rote Linie → POC
- Blaue Linien → VAH (oben) und VAL (unten)
Diese Linien werden Balken für Balken während der Sitzung aktualisiert und zurückgesetzt, wenn ein neuer Handelstag beginnt.
Hauptparameter
Row Size (Pips)
Definiert die Dicke jedes Preisschritts im Profil.-
- Kleinere Werte = detaillierteres Profil
- Größere Werte = glatteres Profil
Value Area %
Prozentsatz der gesamten TPOs, die innerhalb der Value Area enthalten sind (typischerweise 70%).
Die Value Area ist die Preiszone, in der die meiste Marktaktivität während des Tages stattfand.
Wie man es liest
- POC (rote Linie)
-
- Das Preisniveau, das vom Markt an diesem Tag am meisten „akzeptiert“ wurde.
- Wirkt oft als Gleichgewichtsniveau: Der Preis kann an dieser Zone abprallen, stagnieren oder stark durchbrechen.
- Value Area (VAH–VAL, blaue Linien)
-
- Stellt die „faire Wertzone“ dar, in der der meiste Handel stattfand.
- Das Kursverhalten relativ zu VAH/VAL kann zeigen:
-
- Ablehnung extremer Preise (falsche Ausbrüche über VAH/VAL hinaus)
- Akzeptanz neuer Preise (Konsolidierung außerhalb der Value Area)
Typische Anwendungsideen
- Der Preis weist VAL ab und bewegt sich zurück in die Value Area → potenzielle Long-Idee, die auf eine Rückkehr zum „fairen Wert“ (Mean Reversion) setzt.
- Der Preis durchbricht VAH mit Stärke und beginnt, eine Struktur darüber aufzubauen → potenzieller Beginn einer neuen höheren Wertzone (Trendfolge-Szenario).
- Mehrere Tage mit POCs auf ungefähr gleichem Niveau → starke Gleichgewichts-/Akkumulationszone, oft wichtiger Unterstützungs-/Widerstandspunkt.
Zusammenfassung
The indicator plots these levels as horizontal lines on the chart—POC in red, VAH and VAL in blue—updating them bar by bar during the session and resetting daily. Traders use the POC as an equilibrium price level that may act as support or resistance. The Value Area highlights fair value zones, with price action near VAH and VAL signaling potential rejection or acceptance of price extremes. Typical applications include identifying mean reversion opportunities when price rejects VAL or trend-following setups when price breaks above VAH.
Main adjustable parameters include Row Size (pips), controlling profile detail, and Value Area %, defining the percentage of TPOs included in the value area. The indicator supports analysis across various markets including forex, indices, commodities, stocks, and cryptocurrencies.


![„High-Low Divergence [Iridio Capital]“-Logo](https://cdn.ctrader.com/image/webp/443c4661-7abb-40f1-842f-4b6ec560649b_40914)