Beschreibung
Smart Money Concepts — Überblick auf hohem Niveau
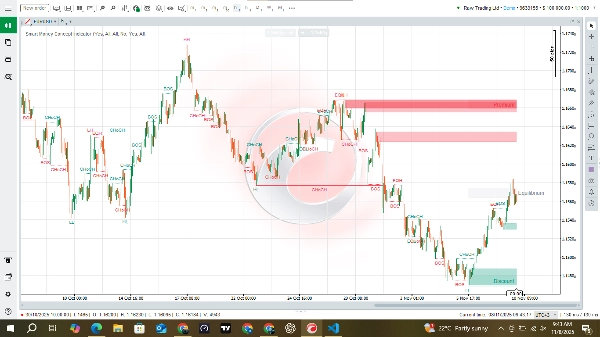
Smart Money Concepts visualisiert, wo professionelle / institutionelle Aktivitäten wahrscheinlich den Preis beeinflusst haben. Es identifiziert automatisch die Marktstruktur (Swing- und kurzfristige Struktur), hebt Strukturbrüche (BOS) und Charakteränderungen (CHoCH) hervor, findet gleiche Hochs/Tiefs, erfasst potenzielle Order-Block-Bereiche (Bereiche, in denen große Akteure möglicherweise Aufträge platziert haben) und zeichnet kontextuelle Zonen (Premium, Gleichgewicht, Rabatt). Es passt sich der Marktvolatilität an, sodass seine Schwellenwerte mit der aktuellen Aktivität des Instruments skalieren.
Was Trader auf einen Blick erhalten
- Klare Beschriftungen, die zeigen, wann die Struktur kippt oder gebrochen wird (hilft Ihnen, die Tendenz zu bestimmen).
- Hervorgehobene Order-Block-Bereiche — potenzielle Angebots-/Nachfragezonen, die der Preis oft erneut testet.
- Markierungen für gleiche Hochs/Tiefs — wahrscheinliche Liquiditätsknoten für Stop-Jagden oder Retests.
- Kontextzonen — Premium (teuer), Gleichgewicht (fairer Wert), Rabatt (günstig) — nützlich für Tendenzen und Ziele.
- Nachziehende starke/schwache Hochs & Tiefs, die kürzliche signifikante Extreme zeigen.
Warum dies für SMC-Trader nützlich ist
- Beschleunigt die Identifikation von Levels: zeichnet Levels ein und speichert sie, sodass Sie nicht manuell nach Wendepunkten und OBs suchen müssen.
- Konsistenz: wendet dieselben Regeln an, um Strukturbrüche und OB-Kandidaten über Instrumente und Zeitrahmen hinweg zu erkennen.
- Kontextuelle Einstiege: zeigt, wo institutionelles Interesse liegen könnte — Trader können Einstiege bei Retests dieser Bereiche planen, anstatt zu raten.
- Risikorahmen: Zonen und OB-Kanten bieten logische Plätze für Stops und Ziele (z.B. Stopps hinter einem OB-Tief/Hoch).
- Multi-Skalen-Workflow: Verwenden Sie die Struktur auf größerer Skala für die Tendenz und die kleinere interne Struktur für präzise Einstiege.
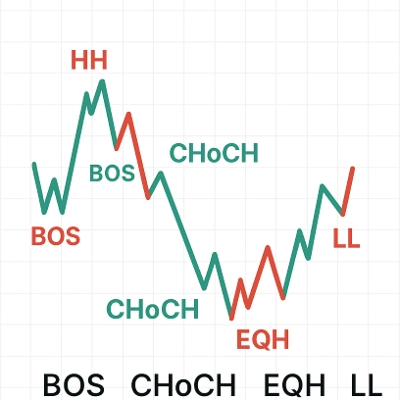
Wie man die Hauptelemente interpretiert
- BOS (Break of Structure) — Fortsetzungssignal in Richtung des Bruchs; nützlich zur Bestätigung des Trends.
- CHoCH (Change of Character) — Hinweis darauf, dass sich das Marktverhalten möglicherweise ändert; als potenzielle Umkehr oder Tendenzverschiebung behandeln.
- Order Blocks (OBs) — Preisbereiche, in denen wahrscheinlich größere Aufträge akkumuliert wurden; erwarten Sie dort Retests und Ablehnungen.
- Gleiche Hochs/Tiefs — wiederholte Levels, an denen Liquidität akkumuliert; oft vor großen Bewegungen anvisiert.
- Premium/Gleichgewicht/Rabatt — eine einfache Wertkarte: Premium bevorzugt Verkäufer, Rabatt bevorzugt Käufer, Gleichgewicht ist neutral/Mittelwert.


![„[Stellar Strategies] Market Session Ultimate“-Logo](https://cdn.ctrader.com/image/webp/61ffd537-0125-4246-9e72-42eca1791d64_28232)


![„[Hamster-Coder] Bollinger Bands“-Logo](https://cdn.ctrader.com/image/webp/21d8e5d6-fb11-4bac-b9ee-cd05c2b76804_30327)


