
Beschreibung
📌 Kalman-Filter-Trend – Übersicht & Bewertung
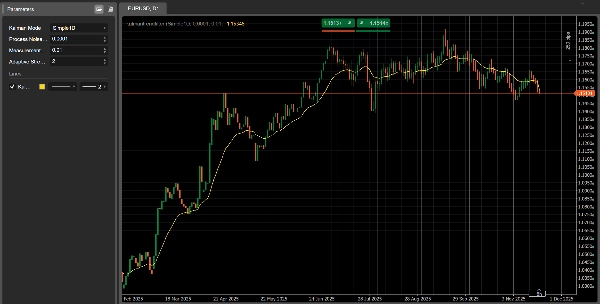
Kalman-Filter-Trend ist ein fortschrittlicher Trendfolgeindikator für cTrader, der entwickelt wurde, um eine glatte, hochreaktive Trendlinie mit deutlich weniger Verzögerung als traditionelle gleitende Durchschnitte zu liefern.
Während klassische SMA/EMA-Filter langsam reagieren und oft frühe Trendwechsel verpassen, tut der Kalman-Filter:
- Aktualisiert kontinuierlich seine Schätzung des „wahren“ Preises
- Balanciert mathematisch Glätte und Reaktionsfähigkeit
- Passt sich der Volatilität an (Adaptiver Modus)
- Modelliert sowohl Preis als auch Geschwindigkeit (2D-Modus)
Das macht ihn zu einem leistungsstarken Werkzeug für manuelle Trader und Entwickler automatisierter Systeme.
🎛 Modi & Parameter
Kalman-Modus (3 Versionen in einem Indikator)
1️⃣ Simple1D
Ein klassischer 1D-Kalman-Filter.
Schnell, sauber und ausgezeichnet für die kurzfristige Trenderkennung.
2️⃣ PositionVelocity2D
Modelliert sowohl Preis als auch Trendgeschwindigkeit.
Ideal als Richtungsfilter in algorithmischen Strategien.
3️⃣ Adaptive1D
Passt sich automatisch der Volatilität an.
Reaktiver in schnellen Märkten, glatter in ruhigen Phasen.
🧩 Wichtige Parameter erklärt
- Prozessrauschen (Q):
Höher = schnellere Trendreaktion, niedriger = glattere Linie. - Messrauschen (R):
Höher = Filter vertraut den Daten weniger → glatteres Ergebnis. - Adaptive Stärke:
Wird nur im Adaptive1D verwendet. Steuert, wie stark die Volatilität den Filter beeinflusst.
📈 Wie man Signale interpretiert
1. Trendrichtung erkennen
- Aufwärtstrend: Linie steigt an, Preis hält sich über dem Filter.
- Abwärtstrend: Linie fällt, Preis hält sich unter dem Filter.
- Seitwärts: Markt bewegt sich seitwärts, Breakout-Strategien vermeiden.
2. Einstiegssignale (Crossover-Logik)
Bullischer Einstieg:
- Preis schließt über der Kalman-Linie
- Die Linie beginnt sich nach oben zu drehen
Bärischer Einstieg:
- Preis schließt unter der Kalman-Linie
- Die Linie beginnt sich nach unten zu drehen
3. Trendstärke (2D-Modus)
Die Steigung wird zu einer direkten Messung des Momentums:
- Starke Aufwärtsneigung → starker Aufwärtstrend
- Starke Abwärtsneigung → starker Abwärtstrend
- Abflachende Neigung → Trend schwächt sich ab oder Übergangsphase
📊 Praktische Anwendungsbeispiele
✔ Trendfolge-Strategie
Verwenden Sie Simple1D oder Adaptive1D:
- Kaufen über der Linie, wenn die Steigung positiv wird
- Verkaufen unter der Linie, wenn die Steigung negativ wird
✔ Multi-Timeframe-Ansatz
- Verwenden Sie Kalman auf H1 für die Richtung
- Verwenden Sie Kalman auf M15 für präzise Einstiege
- Einstiege nur in Richtung des höheren Zeitrahmens
✔ Bot-Integration
Perfekt für algorithmischen Handel:
- Erlaube nur Long wenn Steigung > 0
- Erlaube nur Short wenn Steigung < 0
- Verwende Adaptive1D für volatile Indizes wie US500, NAS100, US2000
🌟 Trete unserer Community bei
Wenn du Zugang möchtest zu:
- Exklusiven Optimierungen für jeden unserer Bots
- Fortgeschrittenen Konfigurationstipps
- Verbesserungen im Trading
- Personalisierte technische Hilfe
- Updates und neue Tools
👉 Tritt unserer Community bei, indem du auf den Link auf meiner Profilseite klickst.
Dort findest du die besten Optimierungseinstellungen für alle unsere Bots, die regelmäßig aktualisiert werden.
Zusammenfassung
Kundenbewertungen
5 | 0 % | |
4 | 100 % | |
3 | 0 % | |
2 | 0 % | |
1 | 0 % |