Beschreibung
Der volumengewichtete Vorteil: Eine vollständige Roadmap für cTrader Momentum
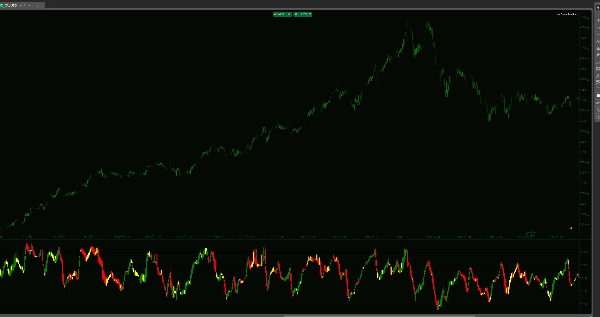
Standardindikatoren zeigen Ihnen, wo der Preis gewesen ist. Der volumengewichtete RSI-Kerzen-Indikator zeigt Ihnen die Überzeugung hinter der Bewegung. Durch die Verschmelzung von Preisaktion, Tick-Volumen und fünf kritischen institutionellen Niveaus verwandelt dieses Tool den RSI von einem einfachen Oszillator in ein umfassendes Trendkartierungssystem.
Anstelle einer einzigen Linie erhalten Sie vollständige OHLC-Kerzen in Ihrem Indikatorfenster. Dies ermöglicht es Ihnen, die "Struktur" des Momentums zu sehen – und zu erkennen, ob eine Bewegung von hohem institutionellem Volumen getragen wird oder einfach eine Low-Liquiditäts-"Falschausbruch" ist.
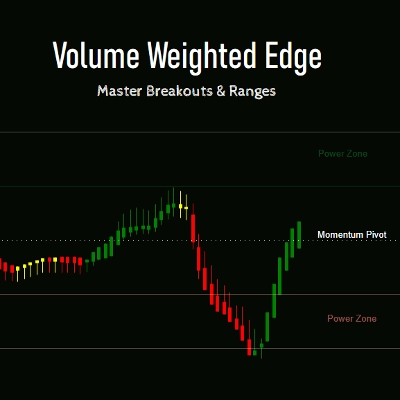
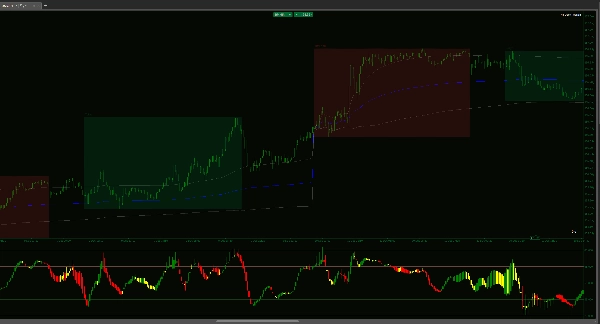
Die 5-Zonen-Ausführungsstrategie
- Die Power Extensions (65–80 & 20–35): Dies sind die Zonen mit hoher Überzeugung. Wenn volumengewichtete Kerzen hier Bestand haben, suchen Sie keine Umkehrungen – Sie folgen dem Trend. Hier operiert das große Geld und hier finden die explosivsten Bewegungen statt.
- Die Scalping-Korridore (50–65 & 35–50): Perfekt für die asiatische Sitzung oder marktseitige Seitwärtsbewegungen. Wenn der Trend im höheren Zeitrahmen neutral ist, bieten diese Zonen hochwahrscheinliche "Mean Reversion"-Ziele. Wenn sich der Markt seitwärts bewegt, ermöglichen Ihnen diese Korridore, die Rotationen mit chirurgischer Präzision zu scalpen.
- Der Momentum-Pivot (50): Die ultimative Linie im Sand. Ein volumengewichteter Kerzenkörper, der über dieses Niveau schließt, ist Ihre erste Warnung vor einer strukturellen Verschiebung der Marktsteuerung.
Warum dieses Tool Ihren Workflow verändert
Volumengewichtete Klarheit: Jede Kerze wird berechnet, indem die Preisänderung mit dem Tick-Volumen multipliziert wird. Wenn eine Bewegung bei geringem Volumen stattfindet, bestätigt die RSI-Kerze sie nicht. Dies hält Sie von "Fallen"-Bewegungen fern, die auf dem Preischart gut aussehen, aber keine Unterstützung haben.
Einblicke in den Kerzenkörper: Traditionelle RSI-Linien sind nervös und gezackt. Unsere WMA- geglätteten Kerzen zeigen Ihnen das "Öffnen" und "Schließen" des Momentums. Wenn der RSI-Kerzenkörper dick und solide ist, ist der Trend gesund. Wenn die Dochte lang sind, ist das Momentum erschöpft.
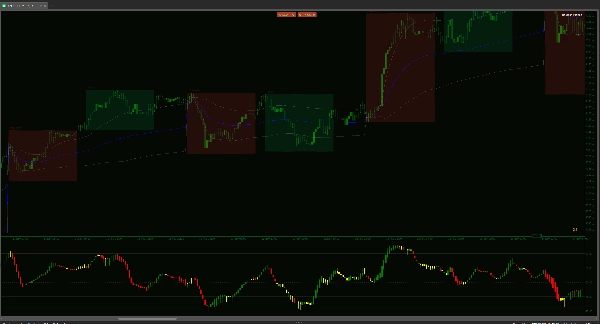
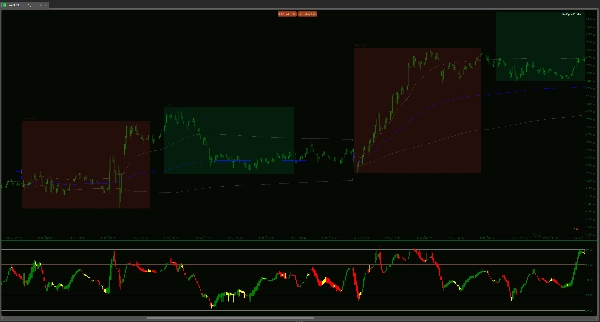
Multi-Markt-Vielseitigkeit: * Trendfolgend: Verwenden Sie den Bereich 65–80, um länger in Gewinntrades zu bleiben.
Seitwärtsbewegung/Scalping: Verwenden Sie die Korridore 35–65, um schnelle Rotationen während Sessions mit niedriger Volatilität wie Asien zu erfassen.
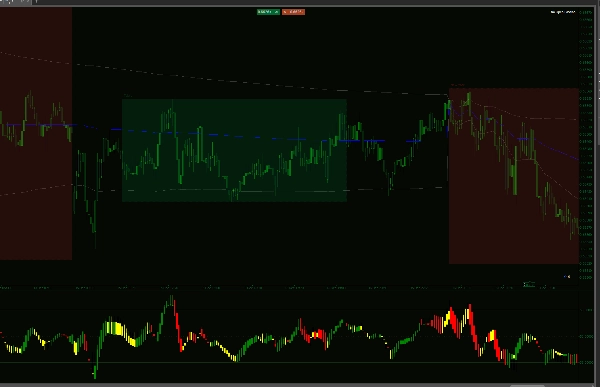
Vermeiden Sie die "Barcode"-Falle: Die meisten Indikatoren zwingen Sie dazu, während Perioden niedriger Volatilität zu raten. Dieser Indikator verfügt über einen einzigartigen visuellen "Barcode"-Effekt während der Konsolidierung. Wenn die Kerzen sich verengen, abflachen und neutral werden, signalisiert der Indikator, dass der "Markt-Motor" aus ist. Diese visuelle Warnung bewahrt Sie davor, in Low-Volume-Falschausbrüche einzusteigen und "zerstückelt" zu werden, wenn kein echtes Geld hinter der Preisbewegung steht.
Native cTrader-Optimierung: Speziell für die C#-API mit "Max Visual Candles"-Logik entwickelt, um sicherzustellen, dass Ihre Plattform auch bei 1-Minuten-Charts reaktionsfähig bleibt.
Hören Sie auf, basierend darauf zu handeln, wohin sich der Markt bewegen könnte. Beginnen Sie zu handeln basierend darauf, wohin das Volumen ihn tatsächlich drängt. Dieser Indikator geht nicht nur um Signale – es geht darum, die innere Energie des Marktes zu verstehen.
Zusammenfassung
Kundenbewertungen
5 | 33 % | |
4 | 67 % | |
3 | 0 % | |
2 | 0 % | |
1 | 0 % |


