
Beschreibung
EMAScalpHistogram: Momentum-Visualisierung für das Handelsmanagement
Was ist EMAScalpHistogram?
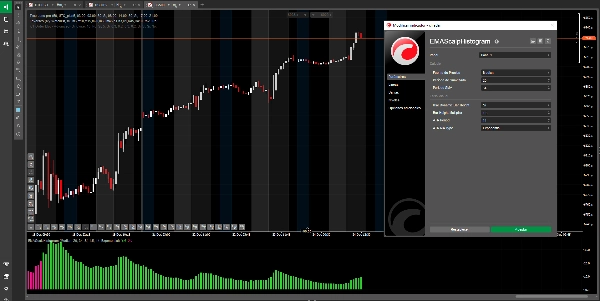
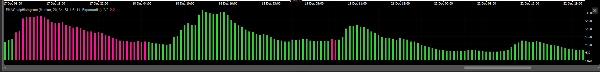
EMAScalpHistogram ist ein fortschrittliches Werkzeug der technischen Analyse, das die Komplexität des Marktmomentums in ein intuitives und visuell ansprechendes Histogramm verwandelt. Sein Design ermöglicht die Identifikation von Trendstärke und -richtung auf einen Blick.
- Grüne Balken (bullisch): Deuten auf starkes Kaufmomentum hin, was darauf hindeutet, dass Käufer den Markt kontrollieren.
- Rosa Balken (bärisch): Deuten auf starkes Verkaufsmomentum hin, was darauf hindeutet, dass Verkäufer die Preisbewegung dominieren.
- Dynamische Höhe: Die Höhe der Balken ist nicht fest; sie passt sich der Marktvolatilität an. Höhere Balken signalisieren Bewegungen mit mehr Stärke und Überzeugung, während kürzere Balken eine Pause oder einen schwächer werdenden Trend anzeigen.
Hauptanwendung und empfohlene Strategie
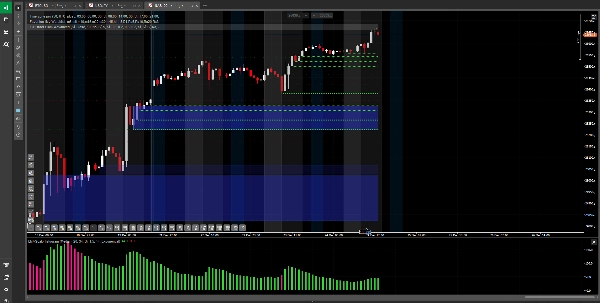
EMAScalpHistogram ist ein erstklassiges Werkzeug für das Handelsmanagement, entwickelt für Trader, die ihre Gewinne maximieren möchten, indem sie Positionen mit größerem Vertrauen halten. Sein größter Wert liegt darin, Ihnen zu helfen, Ihre Gewinne zu erhalten und zu verstärken, sobald Sie bereits in einem Trade sind.
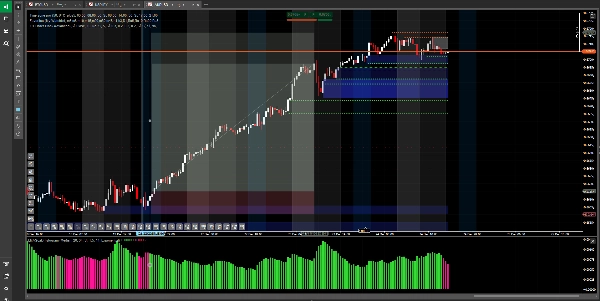
- Trendbestätigung: Seine stärkste Funktion ist die Validierung der Stärke eines bereits identifizierten Trends. Wenn Sie eine Long-Position halten und das Histogramm durchgehend grüne Balken zeigt, ist dies eine visuelle Bestätigung, dass das Kaufmomentum intakt bleibt.
- Handelsmanagement (Halten und Verstärken von Gewinnen):
-
- Positionen halten: Dies ist seine wertvollste Anwendung. Verwenden Sie es, um zu entscheiden, wann Sie eine Position mit Vertrauen halten sollten. Wenn das Histogramm weiterhin Balken zu Ihren Gunsten zeigt, gibt es Ihnen die Disziplin, einen profitablen Trade nicht vorzeitig aufgrund kleiner Marktschwankungen zu schließen.
- Gewinne verstärken: Indem es Ihnen hilft, die Position während der gesamten starken Momentumphase zu halten, ermöglicht es Ihnen, größere Bewegungen zu erfassen und Ihr Gewinnpotenzial zu verstärken.
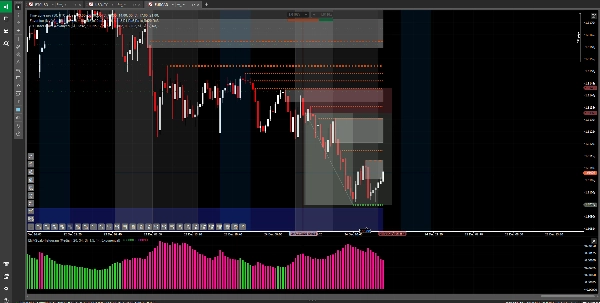
- Warnung vor nachlassendem Momentum: Eine Farbänderung im Histogramm (von grün zu rosa oder umgekehrt) ist eine der ersten Warnungen, dass das Momentum nachlässt, was darauf hindeutet, dass es ein guter Zeitpunkt sein könnte, Gewinne zu sichern oder Ihre Ausstiegsstrategie anzupassen.
Was zu vermeiden ist
Kein Einstiegssignal: Entscheidend ist, dass EMAScalpHistogram nicht als eigenständiges Signal zum Öffnen neuer Trades gedacht ist. Als Indikator, der die Stärke einer bereits laufenden Bewegung bestätigt, kann die Verwendung als Einstieg zu späten Trades mit hohem Risiko und begrenztem Gewinnpotenzial führen.
Risikohinweis und Haftungsausschluss
Die Nutzung dieses Indikators erfolgt auf eigenes Risiko und eigene Verantwortung. Der Handel mit Finanzinstrumenten birgt ein hohes Risiko und ist möglicherweise nicht für alle Anleger geeignet. Dieses Werkzeug stellt keine Anlageempfehlung oder Finanzberatung dar. Vergangene Leistungen sind keine Garantie für zukünftige Ergebnisse. Es wird dringend empfohlen, jede Strategie zunächst auf einem Demokonto zu testen, bevor echtes Kapital riskiert wird.
Zusammenfassung
Kundenbewertungen
5 | 67 % | |
4 | 33 % | |
3 | 0 % | |
2 | 0 % | |
1 | 0 % |


