ADX advanced
Indikator
Version 1.0, Apr 2026
Windows, Mac
4.3
Bewertungen: 3
Beschreibung
ADX Advanced Cloud & Momentum System
Der Standard Average Directional Index (ADX) ist ein leistungsstarkes Werkzeug, aber seien wir ehrlich: Drei sich kreuzende Linien (+DI, -DI und ADX) anzustarren ist unübersichtlich, verwirrend und belastet die Augen.
Der ADX Advanced Indicator modernisiert dieses klassische Werkzeug vollständig. Er verwandelt die chaotischen Linien in eine klare, visuelle Kraftquelle, die Ihnen auf einen Blick genau sagt, WER die Kontrolle hat (Bullen vs. Bären) und WIE STARK der Trend ist.
Hauptmerkmale
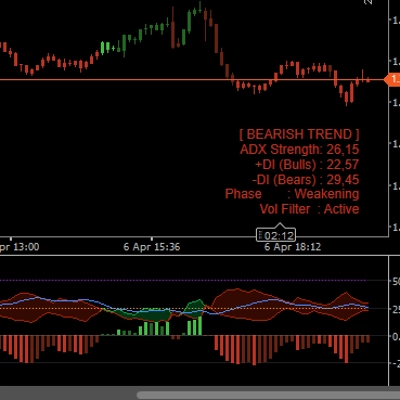
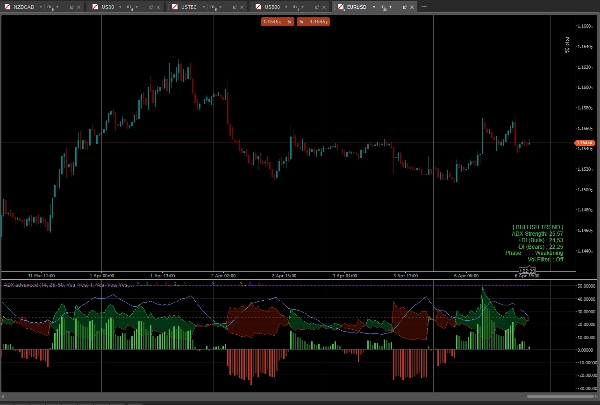
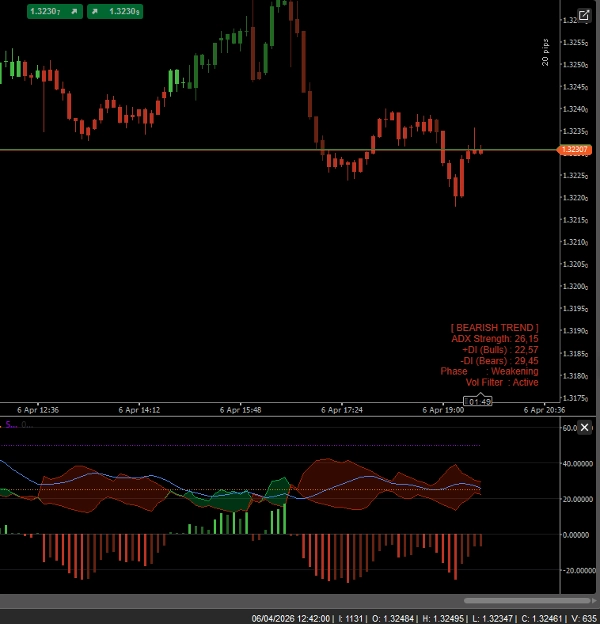
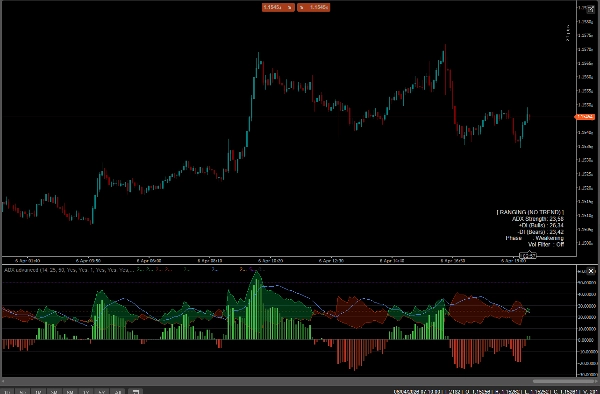
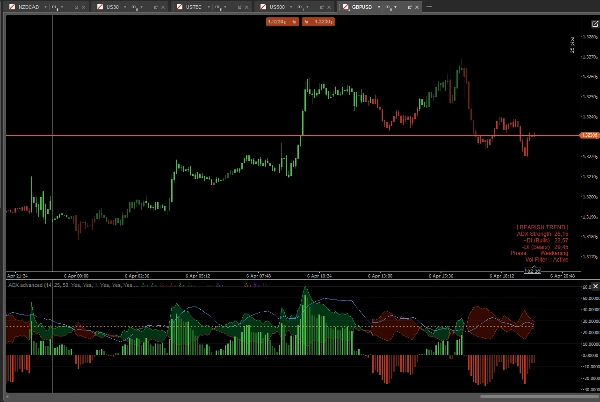
- Directional Clouds (DI Cloud): Statt sich kreuzender Linien wird der Raum zwischen +DI und -DI mit einer dynamischen Farbwolke gefüllt. Grüne Wolke = Bullen haben die Kontrolle. Rote Wolke = Bären haben die Kontrolle.
- Momentum-Histogramm: Ein speziell entwickeltes Histogramm am unteren Rand des Indikators misst den genauen Abstand zwischen +DI und -DI. Es verfügt über Beschleunigungs-/Verzögerungsfarben, die es Ihnen ermöglichen, nachlassendes Momentum zu erkennen, bevor sich der Trend tatsächlich umkehrt.
- Intelligente Balkenfärbung (Paintbars): Der Indikator färbt Ihre Preiskerzen direkt basierend auf der Trendstärke!
-
- Hellgrün/Rot: Starker Trend (ADX > 25 & +DI/-DI Ausrichtung)
- Dunkelgrün/Rot: Schwacher Trend / Seitwärtsbewegung (ADX < 25)
- Lila/Magenta: Extrem überdehnter Trend (ADX > 50) - Machen Sie sich bereit für eine Gegenbewegung!
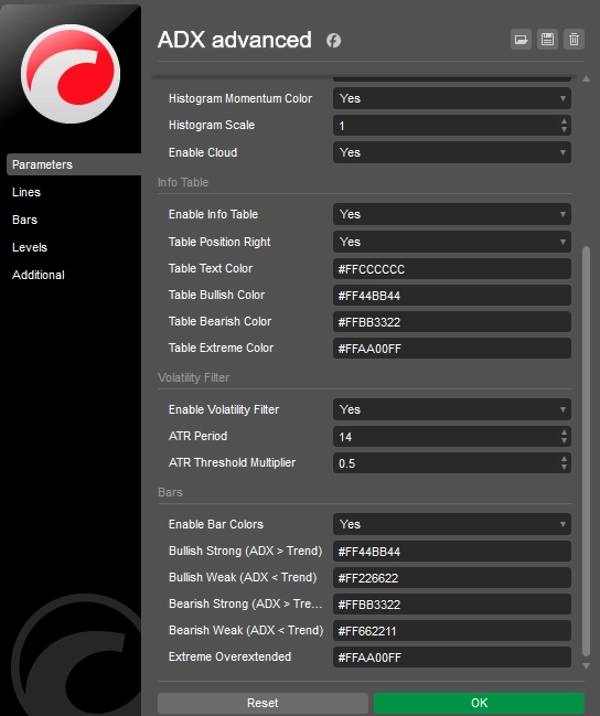
- On-Chart Info Panel: Ein elegantes, unaufdringliches Dashboard zeigt den aktuellen Marktstatus (Trend, Seitwärts, Extrem), ADX-Stärke und Momentum-Phase in Echtzeit an.
- Integrierter Volatilitätsfilter (ATR): Optionaler ATR-Filter, der Kerzen und Histogrammbalken ausgraut, wenn der Markt völlig flach läuft, und Sie so vor dem Handel in Seitwärtsbewegungen schützt.
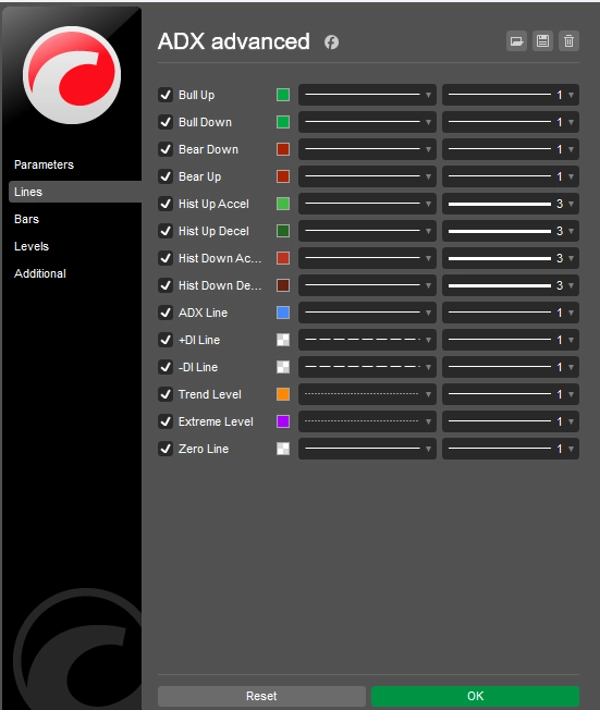
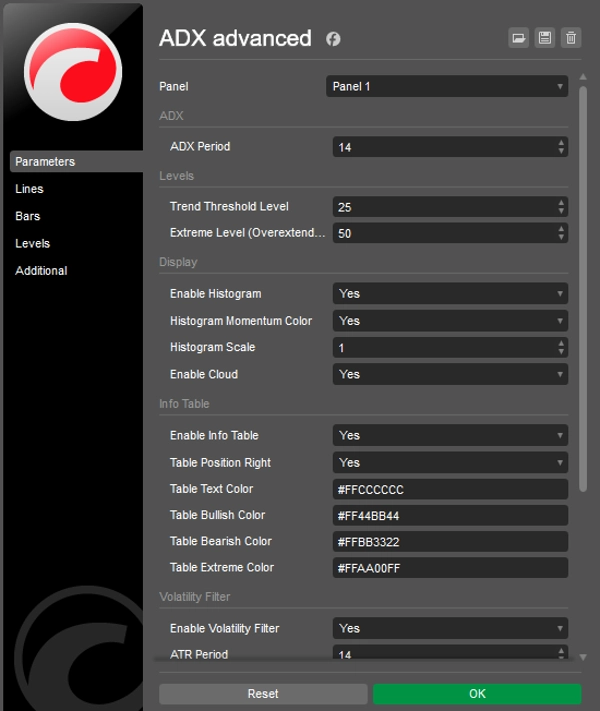
- Vollständig anpassbar: Ändern Sie Farben, Schwellenwerte (Trend-Level 25, Extrem-Level 50) und Histogrammskalierung, um Ihren persönlichen Handelsstil und das Chart-Design anzupassen.
Wie benutzt man es?
- Warten Sie, bis die blaue ADX-Linie die 25er-Schwelle überschreitet (Trend ist aktiv).
- Schauen Sie auf die Wolke und das Histogramm, um die Richtung zu bestätigen (Grün für Long, Rot für Short).
- Handeln Sie die Ausbrüche und reiten Sie den Trend, solange die Kerzen in "starken" Farben gefärbt sind.
- Nehmen Sie Gewinne mit oder setzen Sie Stopps nach, wenn die ADX-Linie das 50er-Extrem-Level überschreitet (Kerzen werden lila).
Zusammenfassung
Indikatorprofil
Kundenbewertungen
4.3
Bewertungen: 3
5 | 33 % | |
4 | 67 % | |
3 | 0 % | |
2 | 0 % | |
1 | 0 % |
Kundenbewertungen
April 16, 2026
April 12, 2026
Diskussion
Häufig gestellte Fragen (FAQ)
BTCUSD
Forex
Signal
Indices
EURUSD
Commodities
GBPUSD
NZDUSD
Prop
XAUUSD
NAS100
ATR
USDJPY
Über den cTrader Store verfügbare Produkte, einschließlich Handelsbots, Indikatoren und Plugins, werden von externen Entwicklern bereitgestellt und nur zu Informations- und technischen Zugriffszwecken verfügbar gemacht. cTrader Store ist kein Broker und erbringt keine Anlageberatung, persönlichen Empfehlungen oder eine Garantie für zukünftige Performance.


Preis
24
Verkäufe
677
Kostenlose Installationen