
Stochastic_advanced
Indikator
Version 1.0, Apr 2026
Windows, Mac
4.2
Bewertungen: 4

32
Verkäufe
993
Kostenlose Installationen
Beschreibung
Stochastic Advanced Cloud & Momentum System (VOLLVERSION)
Der klassische Stochastik-Oszillator ist ein legendäres Werkzeug, um Marktumkehrungen und Momentumverschiebungen zu erfassen, aber das Lesen von zwei dünnen, verworrenen Linien am unteren Bildschirmrand kann visuell verwirrend sein.
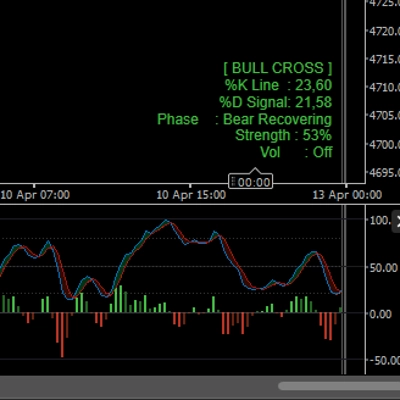
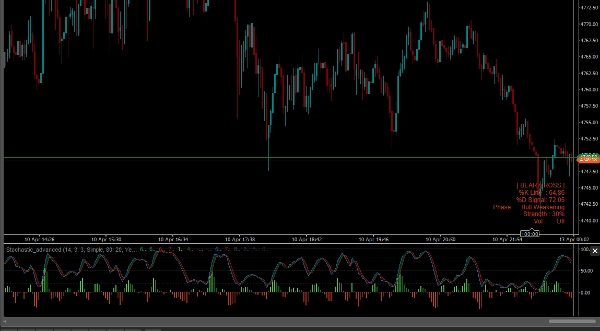
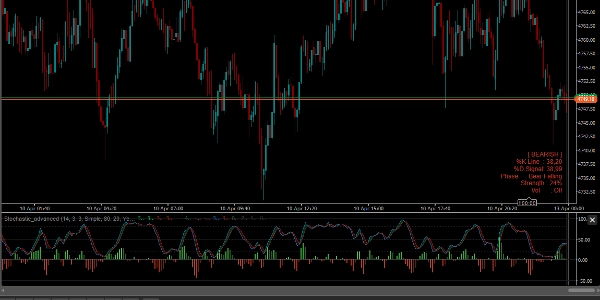
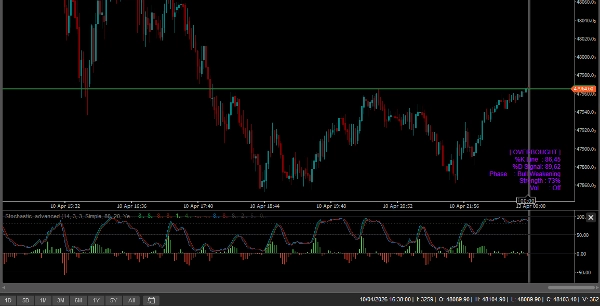
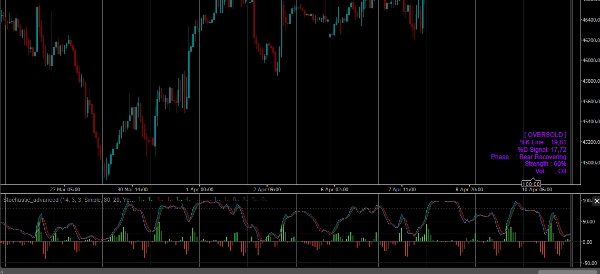
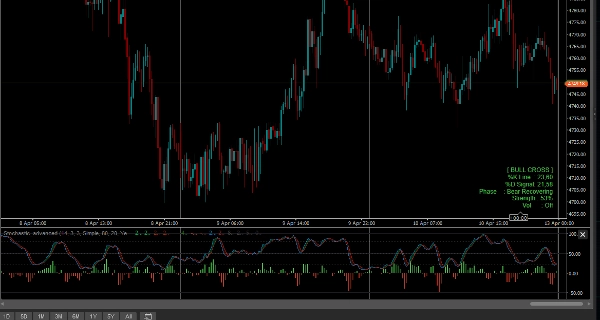
Der Stochastic Advanced Indikator überarbeitet dieses traditionelle Werkzeug vollständig. Durch die Integration visueller Clouds, eines Momentum-Histogramms, Smart Paintbars und eines Volatilitätsfilters verwandelt er den Stochastik in ein hochgradig visuelles, All-in-One-Momentum-Handelssystem.
Hauptmerkmale der VOLLVERSION:
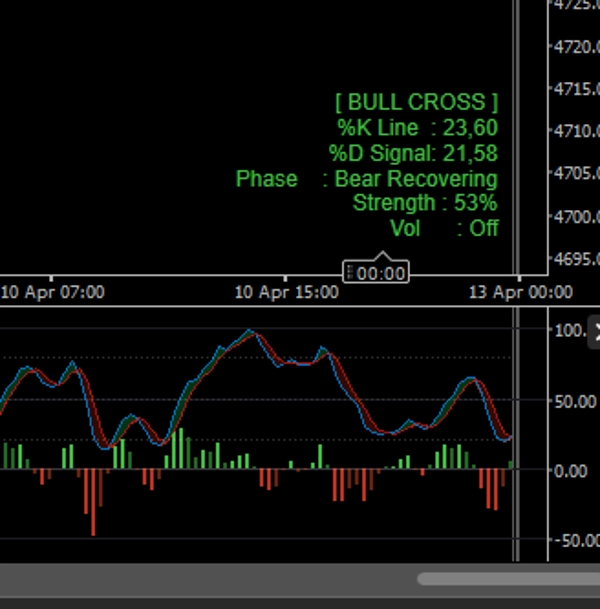
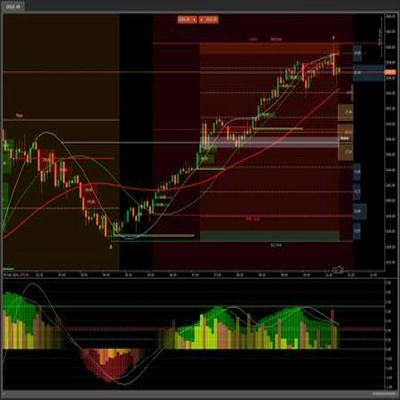
- %K & %D Signal-Cloud: Der Raum zwischen der schnellen Linie (%K) und der langsamen Signallinie (%D) wird dynamisch mit einer farbcodierten Cloud gefüllt. Grüne Cloud = bullisches Überschreiten. Rote Cloud = bärisches Überschreiten. Sie werden kein Signal mehr verpassen.
- Null-Linien-Momentum-Histogramm: Ein benutzerdefiniertes Histogramm am unteren Rand des Indikators misst den genauen Abstand zwischen %K und %D. Es verwendet eine 4-Farben-Beschleunigungs-/Verzögerungslogik, die Ihnen hilft, Momentumverschiebungen zu erkennen, bevor sich die Linien tatsächlich kreuzen.
- Intelligente Balkenfärbung (Paintbars): Der Indikator färbt Ihre Preiskerzen direkt passend zum Stochastik-Momentum:
-
- Hellgrün/Rot: Starke Trendausrichtung (Der Preis bewegt sich in Richtung des Überschreitens).
- Dunkelgrün/Rot: Schwaches Momentum oder potenzielle Rücksetzer.
- Lila/Magenta: Extreme Überkauft (OB) oder Überverkauft (OS) – warnt Sie, sich auf eine Umkehr vorzubereiten.
- Intelligenter Volatilitätsfilter (ATR): Falsche Signale treten oft in flachen, seitwärts gerichteten Märkten auf. Aktivieren Sie den integrierten ATR-Volatilitätsfilter, um Ihre Kerzen und das Histogramm automatisch auszublenden, wenn die Marktvolatilität nachlässt. Wenn es grau ist, bleiben Sie fern!
- Echtzeit-Info-Dashboard: Ein sauberes Panel auf dem Chart zeigt auf einen Blick den aktuellen Marktstatus, genaue %K/%D-Werte, Trendstärke und Volatilitätsstatus an.
- Vollständig freigeschaltet: Handeln Sie mit JEDEM Symbol (Forex, Krypto, Indizes, Aktien) und JEDEM Zeitrahmen ohne Einschränkungen. Lebenslanger Zugang.
Wie handelt man damit?
- Die Umkehr: Warten Sie, bis die Kerzen lila werden (Eintreten in extreme OB/OS-Zonen). Bereiten Sie sich auf einen Trade vor. Sobald die Stochastik-Cloud die Farbe wechselt (z. B. von Rot zu Grün) und das Histogramm beschleunigt, führen Sie Ihren Trade aus.
- Die Trendfortsetzung: Während eines aktiven Trends warten Sie auf einen Rücksetzer, bei dem %K fällt, sich aber schnell erholt. Ein heller Histogrammbalken kombiniert mit einer hell gefärbten Preiskerze signalisiert einen starken Fortsetzungseintritt.
- Vermeidung von Seitwärtsbewegungen: Wenn der Volatilitätsfilter Ihre Balken grau färbt, nehmen Sie keine Überschreitungs-Signale an. Warten Sie, bis Volumen und Volatilität zurückkehren
Zusammenfassung
KI-Zusammenfassung
Stochastic Advanced is an enhanced momentum indicator that transforms the classic Stochastic Oscillator into a visually intuitive trading system. It features a dynamic %K and %D Signal Cloud that color-codes bullish and bearish crossovers, making signals easier to identify. A Zero-Line Momentum Histogram uses a four-color scheme to indicate acceleration and deceleration in momentum, helping traders anticipate shifts before line crossovers occur.
The indicator also includes Smart Bar Coloring (paintbars) that visually align price candles with momentum strength and trend direction, using distinct colors to denote strong trends, weak momentum, and extreme overbought or oversold conditions. A built-in Smart Volatility Filter based on Average True Range (ATR) grays out candles and histogram bars during low volatility periods to help avoid false signals in ranging markets.
An on-chart Real-Time Info Dashboard displays current market state, exact %K/%D values, trend strength, and volatility status for quick assessment. The indicator supports all symbols—including Forex, cryptocurrencies, indices, and stocks—and any timeframe without limitations. It is designed for use in reversal and trend continuation strategies while providing chop avoidance through volatility filtering.
Indikatorprofil
Indikatorkategorie
Volatilität
Ausgabetyp
Signale
Filter
Datenanforderungen
Nur Balken
Unterstützte Signale
Trendstärke
Volatilität
Diskussion
Kundenbewertungen
4.2
Bewertungen: 4
5 | 25 % | |
4 | 75 % | |
3 | 0 % | |
2 | 0 % | |
1 | 0 % |
Kundenbewertungen
April 26, 2026
The first thing that worked was the signal needs a real reason behind it, and the first test should keep DD under 3 percent.
April 24, 2026
What stood out was confusing signals get easier to ignore. Strong trends can keep readings stretched.
April 15, 2026
The logic holds up when bad ideas get easier to avoid, and Overconfidence is the real danger.
April 12, 2026
Häufig gestellte Fragen (FAQ)
ATR
Stochastic
Über den cTrader Store verfügbare Produkte, einschließlich Handelsbots, Indikatoren und Plugins, werden von externen Entwicklern bereitgestellt und nur zu Informations- und technischen Zugriffszwecken verfügbar gemacht. cTrader Store ist kein Broker und erbringt keine Anlageberatung, persönlichen Empfehlungen oder eine Garantie für zukünftige Performance.









Preis
32
Verkäufe
993
Kostenlose Installationen