present
Kaydolun ve ilk alışverişinizde $50 indirim kazanın
Trading product for AW Multi Data Gösterge, image 1
AW Multi Data
5.62K
Ücretsiz yüklemeler

Açıklama

Özet

YZ özeti
AW Multi Data is a trading indicator that displays key trading metrics directly on your chart. It shows the current symbol and timeframe, daily net profit percentage, daily net profit amount, and spread. The indicator requires the timezone to be set to UTC to accurately reflect daily profit values. This tool provides real-time performance data to assist traders in monitoring their trades within the charting interface.
Gösterge profili

Tartışma

Müşteri değerlendirmeleri

0.0
Değerlendirmeler: 0
Müşteri değerlendirmeleri
Bu ürün için henüz bir değerlendirme yok. Ürünü denediniz mi? O zaman ona dair görüşlerini paylaşan ilk kişi olun!

SSS

cTrader Store üzerinden erişilebilen işlem botları, göstergeler ve eklentiler gibi ürünler, üçüncü taraf sağlayıcılar tarafından sağlanır ve yalnızca bilgilendirme ve teknik erişim amaçlarıyla sunulur. cTrader Store bir broker değildir ve yatırım tavsiyesi, kişisel öneriler vermez veya gelecekteki performansı garanti etmez.

Bu oluşturanın diğer ürünleri

"IR Candle MTF" logosu
4.6
(6)
Ücretsiz
with this indicator you could see other time frame candle in your chart.
show spread on chart
some user add moving average to macd to see better. in ctrader 4.3.11 there is a problem with this . I make a macd tha
this indicator show macd on chart.
Multi Time Frame Moving Average is a powerful and flexible indicator for cTrader
 this moving include everything that a trader needs from Moving Average.
this indicaotr show distance between Tenkan to Kijun, Close to Kijun and Close to Tenkan 
Add Slowing to IR Moving Average.
IR Candle Open plots customizable opening price lines for daily, weekly, and monthly candles
Coral indicator
you could put your check list in your chart you could split your test with “,” you could put your checklist in indicat
this indicator show other time frame close in lower time frame. for ex: show daily close in m 15.

Şunları da beğenebilirsiniz

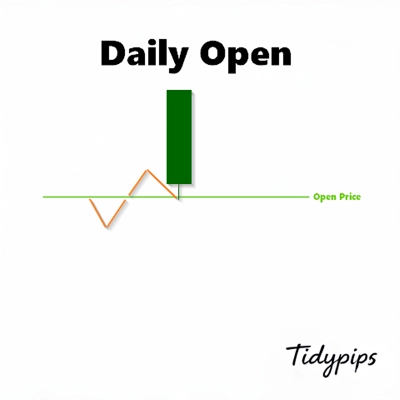
This indicator is a valuable tool for traders looking to identify significant opening price level of any asset.
Smart Money Breakout Channels – Auto-detect breakout zones with price, volume & volatility insights on cTrader.
Day and week separators plus previous day high, low and close lines for every day on H1 and lower charts
All-in-one suite for ICT concepts: NY Midnight Open, Killzones, automatic Liquidity levels (PDH/L, PWH/L).
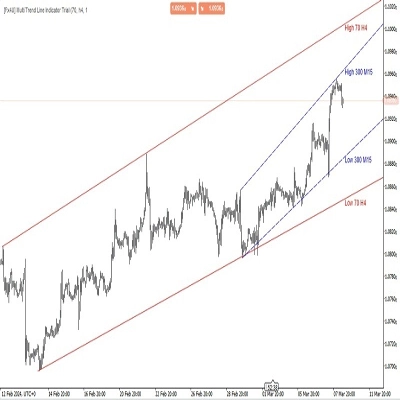
Allow trader to draw multi trendlines in different timeframes on one chart,Give trader an overview of the current market
"ZigXRay" logosu
4.6
(5)
$29
/
$49
ZigZag Market Structure Identifier - Multi-Layer Scanner: Convergent Pivot Detection, 4-TF Overlay & Naked Chart Mode.
PRO Liquidity Sweep + FVG Combo detector with custom Gold/Blue signals & alerts
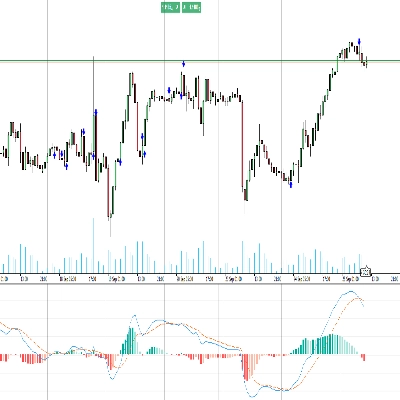
Customize the MACD! Choose colors, get real-time tick updates, and see crossover points for enhanced trading precision.
Detects Break of Structure (BOS) and Change of Character (CHOCH)
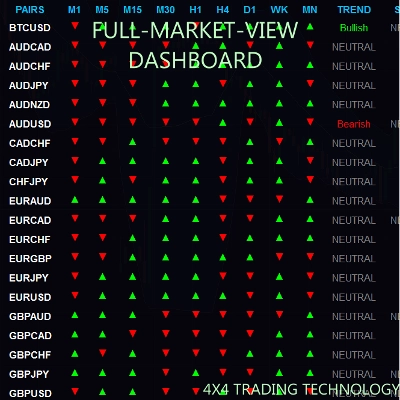
The FULL-MARKET-VIEW-DASHBOARD is a professional-grade trading suite for cTrader that eliminates market noise.
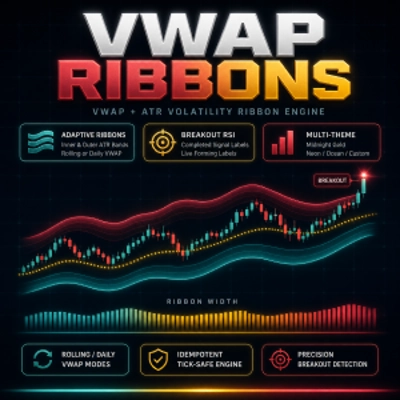
VWAP with ATR ribbon bands and RSI labels on completed breakouts — live forming labels on cTrader.
Simple professional trend tracker
AI-powered daily range forecasts help traders spot volatility opportunities and plan stops and targets.
"AutoAVWAP" logosu
4.5
(4)
$19
/
$25
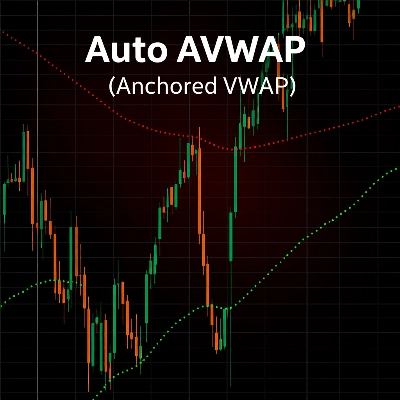
The best automatic anchored VWAP indicator every trader can get help from.
Dense EMA rainbow + Pro tools & a tested engine — get more from your EMAs, your research base for EMA bots.
Easy Trade: Trend & Breakout Indicator for cTrader
Next-gen Volume Oscillator using Hyperbolic Tangent math. No repainting. Includes arrows, alerts, and overlay mode 🎯
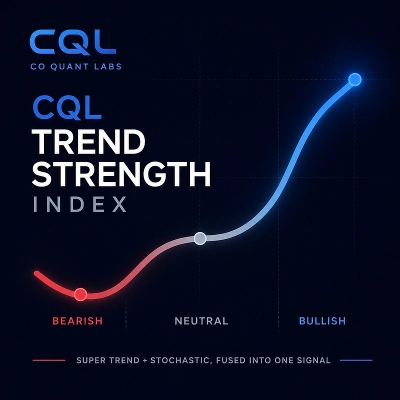
One glance, one answer. Strong Buy, Strong Sell, or Ranging from a single fused Supertrend + Stochastic signal.

Fiyat

5.62K
Ücretsiz yüklemeler