
설명
분석 내용
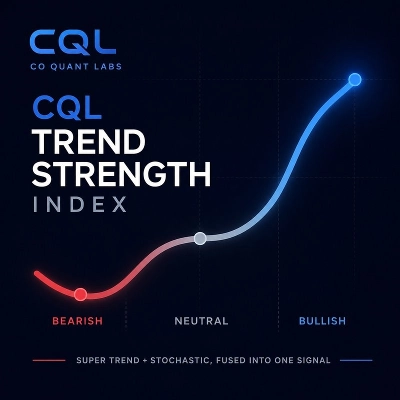
CQL 트렌드 강도 지수는 슈퍼트렌드와 스토캐스틱을 차트에서 두 개의 별도 도구로 실행하는 대신 하나의 통합 신호로 결합합니다. 가격 방향과 모멘텀을 함께 읽어 현재 시장 상황을 강한 매수, 강한 매도, 횡보 중 하나로 분류합니다.
신호 해석 방법
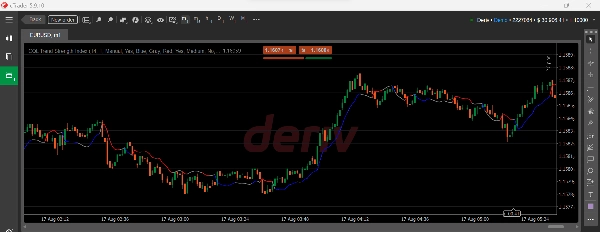
지표는 가격 위에 단일 부드러운 선을 그립니다. 선의 색상은 한눈에 모든 것을 알려줍니다:
- 파란색은 강한 매수를 의미합니다. 가격과 모멘텀이 모두 강한 상승세를 확인합니다.
- 빨간색은 강한 매도를 의미합니다. 가격과 모멘텀이 모두 강한 하락세를 확인합니다.
- 회색은 횡보를 의미합니다. 모멘텀이 중립 구간에 있어 가격 방향과 상관없이 확신이 낮음을 신호합니다.
이 도구는 진입 신호 생성기가 아니라 추세 상황 도구입니다. 현재 시장의 특성을 알려주어 강한 추세에 따라 거래하는지 아니면 횡보 구간에서 거래하는지 더 잘 인지하며 자신의 진입 방식을 적용할 수 있게 합니다.
주요 설정 및 매개변수
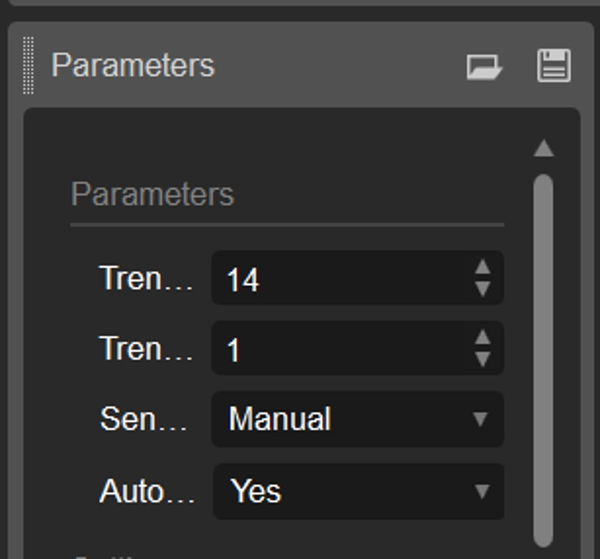
- 추세 기간과 추세 반응성은 지표가 얼마나 빠르거나 느리게 반응하는지 완전히 제어할 수 있습니다
- 감도 사전 설정(느림, 중간, 빠름, 수동)으로 원시 수치를 건드리지 않고 빠르게 조정할 수 있습니다
- 시간 프레임에 자동 적응은 차트에 따라 감도를 자동으로 조정합니다
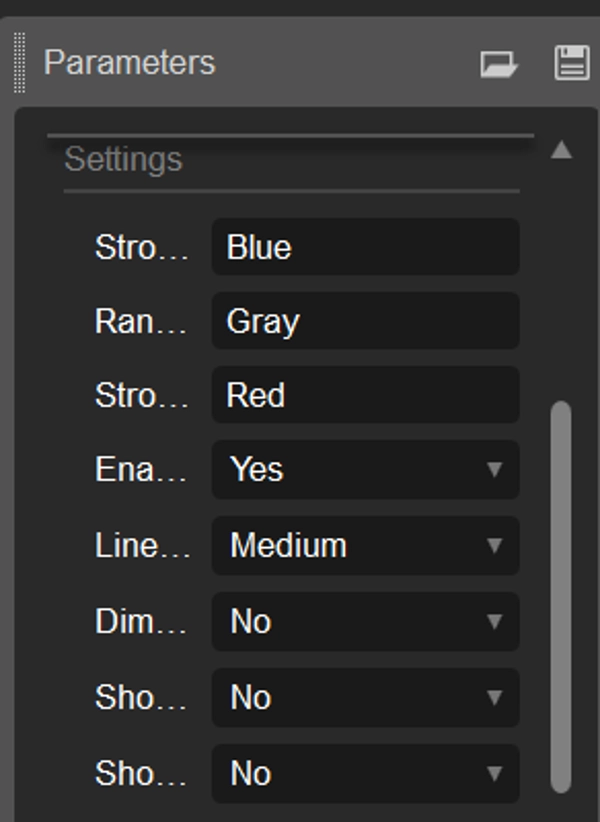
- 설정 탭에서는 전체 색상 사용자 지정, 선 두께, 상태 라벨, 배경 영역 색조, 기본값으로 재설정 옵션을 다룹니다
일반적인 사용 사례
- 다른 도구나 방법으로 진입점을 찾기 전에 시장이 강한 추세인지 빠르게 확인
- 추세 추종 전략이 일반적으로 성과가 떨어지는 횡보 또는 변동성 큰 조건 필터링
- 두 개의 별도 지표를 해석하지 않고도 추세 건강 상태를 빠르게 시각적으로 파악
대상 사용자
수동 또는 자동화된 진입 방식을 이미 가지고 있으며 빠르고 신뢰할 수 있는 추세 상황 필터를 추가하고자 하는 트레이더. 규칙 기반 시스템을 구축하는 사람뿐 아니라 재량적 스윙 트레이더에게도 적합하며, 명확한 추세 대 비추세 분류가 필요합니다.
제한 사항 및 사용 주의
- 이 지표는 추세 상황 지표이며 매수 또는 매도 진입 신호가 아닙니다. 반전 예측이나 거래 진입을 생성하지 않습니다
- 모든 추세 추종 도구와 마찬가지로 새로운 추세 시작 시 지연이 발생하며, 모멘텀이 낮은 돌파 시에는 횡보 상태를 유지할 수 있습니다
- 독립적인 거래 시스템이 아니라 자신의 위험 관리 및 진입 확인과 함께 사용하는 것이 가장 좋습니다
요약
AI 요약
The CQL Trend Strength Index is a technical indicator that combines Supertrend and Stochastic signals into a single, smoothed line plotted directly on the price chart. It classifies market conditions into three states: Strong Buy (blue), Strong Sell (red), or Ranging (gray), reflecting the combined analysis of price direction and momentum. This indicator serves as a trend context tool, helping traders quickly assess whether the market is trending strongly or moving sideways, rather than generating specific trade entry signals.
Key features include adjustable Trend Period and Reactivity settings, sensitivity presets (Slow, Medium, Fast, Manual), and automatic adaptation to the chart’s timeframe. Users can customize colors, line thickness, labels, and background zone tinting. Typical use cases involve confirming strong trends before applying entry methods, filtering out ranging conditions where trend-following strategies may underperform, and obtaining a clear visual read of trend health without managing multiple indicators.
Designed for traders with existing entry strategies, it supports discretionary and rule-based trading by providing a reliable trend versus no-trend classification. The indicator requires integration with personal risk management and entry confirmation techniques and is intended for use across various markets where price bars are available.
Key features include adjustable Trend Period and Reactivity settings, sensitivity presets (Slow, Medium, Fast, Manual), and automatic adaptation to the chart’s timeframe. Users can customize colors, line thickness, labels, and background zone tinting. Typical use cases involve confirming strong trends before applying entry methods, filtering out ranging conditions where trend-following strategies may underperform, and obtaining a clear visual read of trend health without managing multiple indicators.
Designed for traders with existing entry strategies, it supports discretionary and rule-based trading by providing a reliable trend versus no-trend classification. The indicator requires integration with personal risk management and entry confirmation techniques and is intended for use across various markets where price bars are available.
지표 프로필
지표 카테고리
추세
출력 유형
시각화
데이터 요구 사항
막대만
지원되는 신호
추세 강도
고객 리뷰
0.0
리뷰: 0
고객 리뷰
이 상품에 대한 리뷰가 아직 없습니다. 이미 사용해 보셨나요? 다른 사람들에게 가장 먼저 소개해 주세요!
상담
자주 묻는 질문(FAQ)
Premium/Discount
Supertrend
MSS
Stochastic
트레이딩 봇, 지표, 플러그인 등 cTrader Store에서 제공되는 상품은 제3자 개발자에 의해 제공되며, 이는 단순히 정보 및 기술적 접근을 목적으로 제공된 것입니다. cTrader Store는 중개인이 아니며, 투자 조언, 개인별 추천 또는 향후 성과에 대한 어떠한 보장도 제공하지 않습니다.
이 작성자의 상품 더 보기














!["[Hamster-Coder] Moving Average MTF" 로고](https://cdn.ctrader.com/image/webp/b11b98b1-194d-4b8e-b00e-d611826ad159_31226)


가격
36.24K
거래량
336
핍 수익
2
판매
63
무료 설치