present
Registrieren Sie sich und erhalten Sie $50 Rabatt auf Ihren ersten Kauf
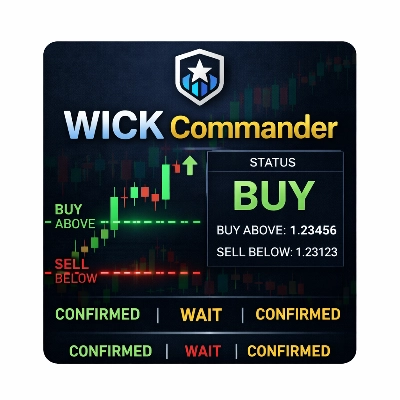
Trading product for Buy and Sell Commander Indikator Aggressive Supertrend, image 1
Buy and Sell Commander
Indikator
Version 1.0, May 2026
Windows, Mac
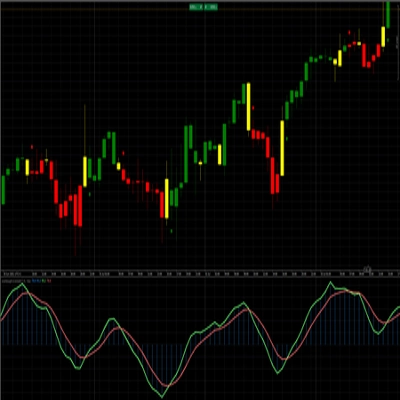
Trading product for Buy and Sell Commander Indikator Aggressive Supertrend, image 2
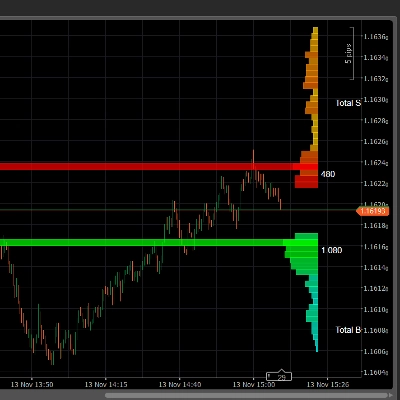
Trading product for Buy and Sell Commander Indikator Aggressive Supertrend, image 3
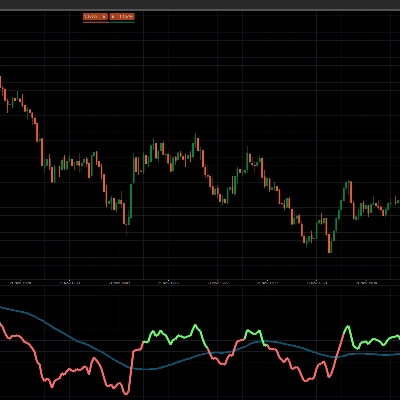
Trading product for Buy and Sell Commander Indikator Aggressive Supertrend, image 4
86
Verkäufe
1.18K
Kostenlose Installationen

Beschreibung

BUY & SELL Commander is designed to help traders quickly understand the current market direction without overcomplicating the chart.

The indicator displays a simple dashboard at the top of the chart showing the active market status:

BUY
SELL
or
NEUTRAL

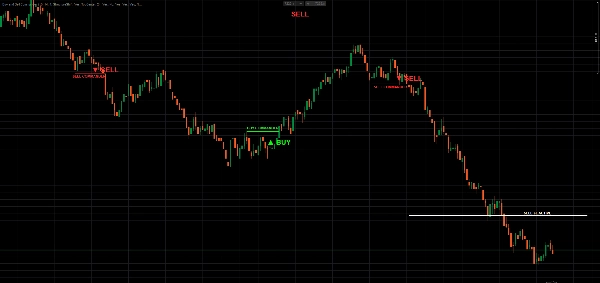
It also plots clear BUY and SELL signals directly on the chart and uses a white Active SL Line as a dynamic trend-flip level.

The goal of this indicator is simple:

to help traders see when buyers or sellers are currently in control.


How It Works

The indicator uses market structure and an ATR-based active stop line to determine the current trading direction.

In simple terms:

  • When the market is bullish, the dashboard shows BUY.
  • When the market is bearish, the dashboard shows SELL.
  • Before a valid signal appears, the dashboard shows NEUTRAL.

The white Active SL Line is the key part of the indicator.

When BUY is active, the white line normally follows below price.
When SELL is active, the white line normally follows above price.


Close Cross Active SL Mode

In CloseCrossActiveSL mode, the logic is very easy to understand.

When the indicator is in SELL mode, price must close above the white SELL SL ACTIVE line to trigger a new BUY signal.

When the indicator is in BUY mode, price must close below the white BUY SL ACTIVE line to trigger a new SELL signal.

So the basic logic is:

SELL active + candle closes above the Active SL Line = BUY signal

BUY active + candle closes below the Active SL Line = SELL signal

The indicator uses candle close confirmation, not only wick movement. This helps reduce false flips caused by temporary spikes.


What the Indicator Shows

Dashboard

A simple dashboard displays the current status:

  • BUY
  • SELL
  • NEUTRAL

This makes it easy to see the current direction at a glance.

BUY and SELL Signals

The indicator marks direction changes on the chart with clear signals:

  • ▲ BUY
  • ▼ SELL

Active SL Line

The white Active SL Line works as a dynamic trend-following stop line.

In BUY mode, the line follows below price.
In SELL mode, the line follows above price.

When price closes through this line, the market direction can change.


Main Features

  • Simple BUY / SELL / NEUTRAL dashboard
  • Clear BUY and SELL chart signals
  • ATR-based Active SL Line
  • Candle close confirmation
  • Market structure based signal detection
  • Optional CloseCrossActiveSL mode
  • Adjustable ATR settings
  • Adjustable dashboard position
  • Clean overlay display
  • Suitable for multiple timeframes and symbols


Recommended Use

BUY & SELL Commander can be used as:

  • a trend direction filter
  • a visual trailing stop guide
  • a trade confirmation tool
  • a market bias dashboard
  • a simple BUY / SELL decision support indicator

Example usage:

If the dashboard shows BUY, traders may focus mainly on buy opportunities.
If the dashboard shows SELL, traders may focus mainly on sell opportunities.
If the dashboard shows NEUTRAL, traders may wait for a valid signal.


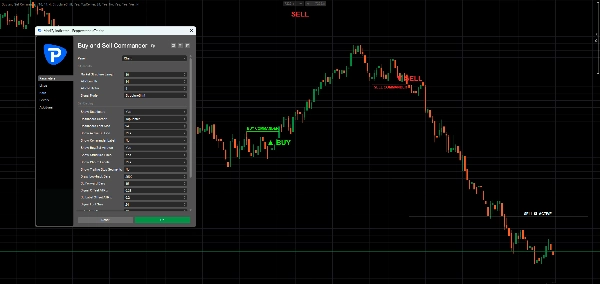
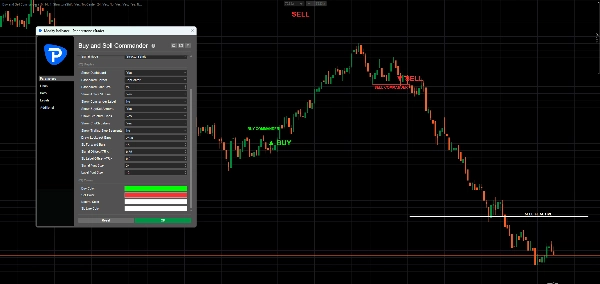
Main Settings

Market Structure Length

Controls how sensitive the indicator is to market swings.

Lower values create faster signals.
Higher values create smoother and slower signals.

ATR Length

Controls the ATR calculation period.

ATR Multiplier

Controls the distance of the Active SL Line from price.

Lower values make the line tighter and more sensitive.
Higher values make the line wider and smoother.

Signal Mode

Choose between:

StructureShift
Uses market structure breaks to detect direction changes.

CloseCrossActiveSL
Uses candle close crosses of the Active SL Line to detect direction changes.

Dashboard Position

Choose where the BUY / SELL / NEUTRAL dashboard appears on the chart.


Simple Trading Logic

The indicator is built around one simple idea:

Trade with the active direction until price closes through the Active SL Line.

When BUY is active, the market bias remains bullish until price closes below the Active SL Line.

When SELL is active, the market bias remains bearish until price closes above the Active SL Line.


Important Note

This indicator does not guarantee profitable trades and should not be used as a standalone trading system. It is designed as a visual decision-support tool. Always combine it with your own strategy, risk management, and market analysis.


Disclaimer

Trading forex, indices, commodities, and other financial markets involves risk. Past performance does not guarantee future results. Use this indicator for analysis and educational purposes only.

Zusammenfassung

Indikatorprofil
Indikatorkategorie
Trend
Ausgabetyp
Signale
Datenanforderungen
Nur Balken
Tick-Daten
Unterstützte Signale
Durchbrechen
Ausbruch
Wendepunkt
Level – Durchbrechen

Diskussion

Kundenbewertungen

0.0
Bewertungen: 0
Kundenbewertungen
Bisher gibt es keine Bewertungen für dieses Produkt. Haben Sie es schon ausprobiert? Dann können Sie die erste Person sein, die andere darüber informiert!

Häufig gestellte Fragen (FAQ)

Aggressive
Supertrend
Über den cTrader Store verfügbare Produkte, einschließlich Handelsbots, Indikatoren und Plugins, werden von externen Entwicklern bereitgestellt und nur zu Informations- und technischen Zugriffszwecken verfügbar gemacht. cTrader Store ist kein Broker und erbringt keine Anlageberatung, persönlichen Empfehlungen oder eine Garantie für zukünftige Performance.

Mehr von diesem Autor

Indikator
AI
ATR
+27
SR Commander is a clean and intelligent support and resistance indicator for cTrader, built to help traders identify key
Indikator
AI
ATR
+20
Buy and Sell Signals
Indikator
AI
ATR
+27
WICK COMMANDER — Know Exactly When the Market Commits
Indikator
AI
ATR
+27
Overbought Oversold Indicator
Indikator
AI
ATR
+20
Know Sure Thing (KST) momentum engine
Indikator
AI
SMC
+5
Coloring trendline/ Colored Trendline / Color Trendline
Indikator
AI
ATR
+27
VWAP Sniper Elite -- Institutional Trend Engine
Indikator
AI
SMC
+13
Dynamic Liquidity Depth exposes hidden volume
Indikator
AI
ATR
+26
Entry Momentum MACD Power Guide
Indikator
AI
ATR
+27
The Professional “All-in-One” Trading Suite (buy and sell indicator)
Indikator
AI
ATR
+26
SR Commander — Multi Timeframe Edition. See where the big money draws the line. Trade on your timeframe. Think on theirs
„crossover 1“-Logo
Beste Ratings
4.2
(5)
$19
/
$29
Indikator
AI
Grid
+10
Crossover Buy and Sell Alerts and signals

Das könnte Sie auch noch interessieren

Indikator
ATR
MSS
+5
Advanced market structure and institutional cycle mapper with visual reference cards and entry alerts
Indikator
ATR
SMC
+15
Plot ATR-based SL and 1R/2R/3R TPs instantly for any trade, with clear R-multiple risk mapping.
Indikator
Prop
Forex
+4
This is an indicator that can alert you about trendlines, horizontal lines and vertical lines.
Indikator
ATR
BOS
+5
Opening ranges, dynamic trend channels, and multi-scale breakout/retest analysis for clear intraday chart decisions.
Indikator
Volume
Key Levels
+1
Session volume profiles from tick volume: POC, value area high and low, and naked POCs extended until touched.
Indikator
Forex
BTCUSD
+4
🚀 HALF TREND Indicator - The Ultimate Trend Following System 🚀
Indikator
Forex
EURUSD
+7
Institutional Session Levels Pro OHLC,Prev(D,W,M OHLC)
Indikator
RSI
VWAP
+5
Trend direction, chart signals, reversal zones and volume tools in one configurable indicator.
Indikator
ATR
EMA
+3
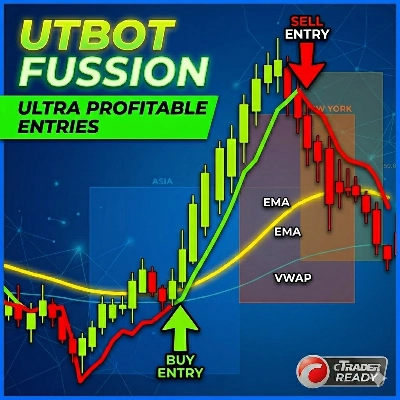
The UTBot you know from TradingView — now on cTrader with confirmed signals, VWAP, EMA and session overlays.
Indikator
AI
ATR
+27
Overbought Oversold Indicator
Indikator
ATR
Volume
+2
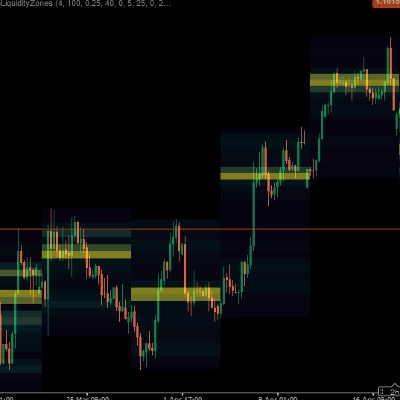
Heatmap Liquidity Zones Visualize volume-at-price, uncover hidden support/resistance, and track market liquidity in real
Indikator
RSI
SMC
+4
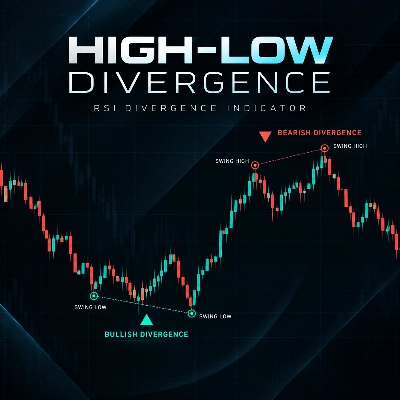
High Low Divergence is a clean, overlay indicator that automatically identifies swing highs and swing lows
Indikator
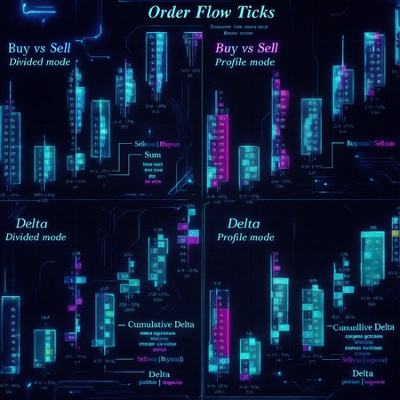
Advanced customizable volume-profile indicator with buy/sell levels, delta analysis, multi-TF support and vivid gradient
Indikator
ADX
ATR
+5
Ten confluence layers scored on every closed bar, with an anti-chop gate, pivot levels and a live dashboard.
Indikator
Forex
cTrader ZigZag Alerts: Precision Swing Detection, Alerts, and Fibonacci.
Indikator
ADX
ATR
+5
Signal Quality Score - 0-100 filter combining RSI, Volume, ATR, Trend Strength & Alignment. Works on ANY chart type.
Indikator
Doji
Wedge
+5
Angora Pattern Recognition is a cTrader indicator that finds, draws and tracks classic chart patterns automatically.
Indikator
Smart Liquidity Zones PRO auto-detects liquidity grabs, wicks, traps & manipulations — trade like the smart money.

Preis

86
Verkäufe
1.18K
Kostenlose Installationen