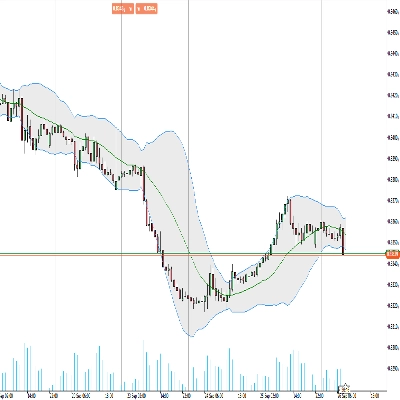
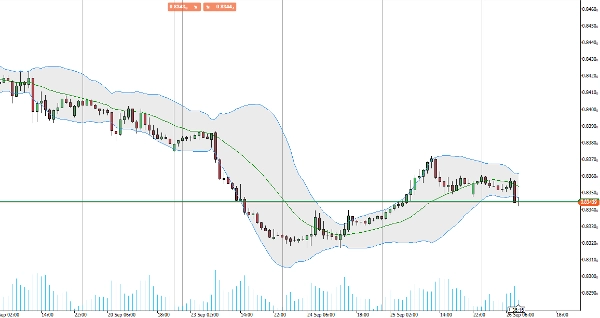
Indikator
breakout
bollinger
„RT Bollinger Bands Cloud“-Logo
RT Bollinger Bands Cloud
0.0
03/09/2025
0
Desktop
In „RT Bollinger Bands Cloud“ hochgeladenes BildIn „RT Bollinger Bands Cloud“ hochgeladenes Bild

Introducing our enhanced Bollinger Bands indicator, designed to elevate your trading experience with clearer visualization.

This visual enhancement makes it easier to interpret market volatility and identify potential breakout and reversal points. Ideal for traders seeking clearer insights and improved decision-making.

Upgrade your trading toolkit today for sharper analysis and better results.

Mehr von diesem Autor
RT MACD
Customize the MACD! Choose colors, get real-time tick updates, and see crossover points for enhanced trading precision.
RT Chandelier Exit
Optimize exits with Chandelier Exit! Visualize stop-loss points dynamically for improved trading precision and safety.
Indikator
breakout
atr
RT ATR Bands
Enhance trading with ATR Bands! Visualize market volatility using dynamic upper and lower ATR bands for precise decision
RT VWAP
Unlock VWAP in cTrader! Choose anchor periods, price sources, and display deviation bands with real-time tick updates.
Indikator
breakout
RT Consolidation Zones
Identify and trade breakouts with Consolidation Zones! Visualize price consolidation areas for trading opportunities.
RT TradingView ATR
Upgrade to ATR-RMA! Experience the precise ATR using Relative Moving Average for accurate volatility analysis in cTrader
Indikator
indices
RT True Strength Index
Enhance trading with TSI! Use the True Strength Index for clear insights into market momentum and trend strength.
RT Stochastic RSI PRO
Unlock Stochastic RSI PRO in cTrader! Overlay RSI, highlight zones, and identify divergences with customizable settings.
Indikator
breakout
RT Standard Deviation Channel_noSourceCode
Visualize trends with Standard Deviation Channel! Display median, and add customizable upper/lower deviation channels.
Indikator
bollinger
RT Qualitative Quantity Estimation
Unlock trading precision with QQE! Dual QQE indicators with a Bollinger Bands zero line provide clear buy/sell signals.
RT Moving Average PRO v1.1
Customize your Moving Average! Choose any timeframe and price source for precision and flexibility in your analysis.
RT MACD Histogram
Enhance MACD Histogram! Visualize bull and bear price changes with vibrant colors for clearer, more insightful trading.
RT Relative Moving Average
Bring the RMA to cTrader! This is the Relative Moving Average from TradingView.
RT Time Segmented Volume
Enhance trading with TSV! Analyze volume flow and price trends using the powerful Time Segmented Volume indicator.
Das könnte Sie auch noch interessieren
IR Slowing Moving
Add Slowing to IR Moving Average.
Zigzag T3
Three ZigZag lines
ictkillzonesfromnovem
ICT ALL KİLL ZONES, LONDON , ASİA, NY AM, NY LUNCH, NY PM
Zero Lag Exponential Moving Average
ZLEMA (Zero Lag EMA) is a faster, smoother version of EMA, ideal for capturing quick market shifts and trends.
Indikator
breakout
atr
signal
UT Bot
ATR-based trend following tool with trailing stop logic. Highlights crossovers using clean up/down bands and bar colour.
Indikator
indices
MFI-MTF
Multi-timeframe Money Flow Index
TrendMagicOptimized
Clean trend indicator using CCI & ATR. Highlights up/down trends with adaptive, no-repaint lines.
Beste Ratings
High TF Plotter
Captra High TF Plotter visualizes high timeframe Bar on lower timeframe charts, highlighting with bull/bear colors.
Indikator
breakout
btcusd
supertrend
+4
ZScore Reversion
Z-Score: Measures price deviations from its mean. Spots overbought/sold (±2-3 SD) & reversals. Key for stats trading
Decision Point
Decision Point
ADX and ADI
This custom indicator is a complete implementation of the Average Directional Index and Directional Indicators.
Trend Direction Force Index - TDFI (Alerts)
Spot Strong Trends Early & Filter Market Noise
Indikator
forex
indices
gbpusd
+2
HorizontalSupportResistance
This extraordinary multi-timeframe support and resistance indicator is nothing short of market wizardry.
Ctrader Liniar Chart
Simple and efficient Indicator Designed to be profitable .With alarms for trend changes and support - resistance
Time To Break Even Lite Version
This is the trial version of Time To Break Even, which help you time your trade entry.
IR Ichimoku Macd
this indicaotr show distance between Tenkan to Kijun, Close to Kijun and Close to Tenkan 
Supply Demand V1-Premium
Auto-detect supply & demand zones, remove broken levels, and trade smarter with real-time alerts. Precision made simple.
overbought oversold
Overbought Oversold Indicator