Series - FXMaster
28/09/2025
1
Desktop
Since 11/01/2025
Sales
11
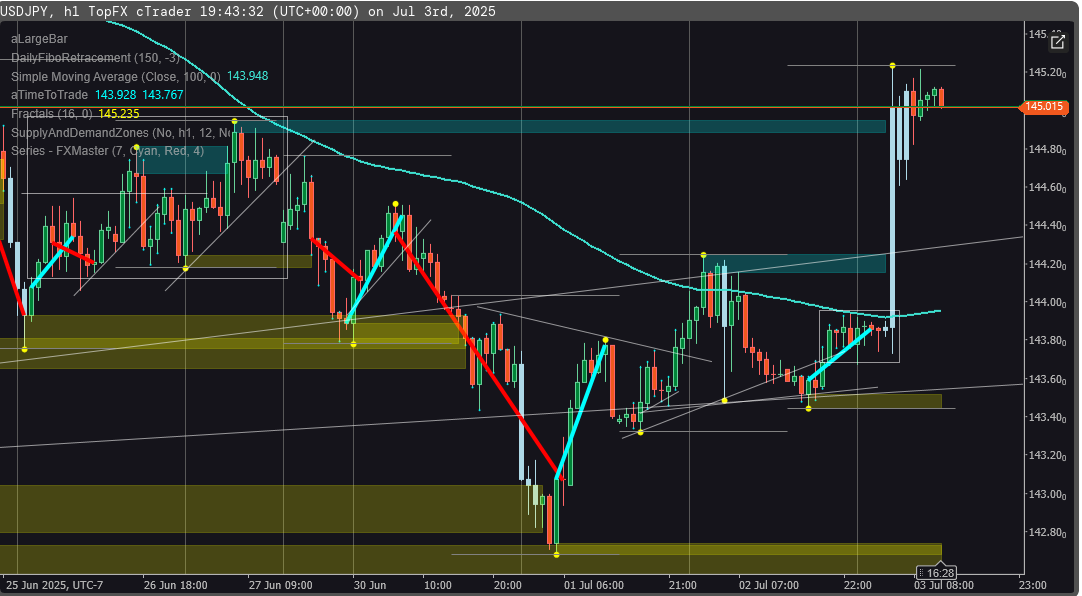
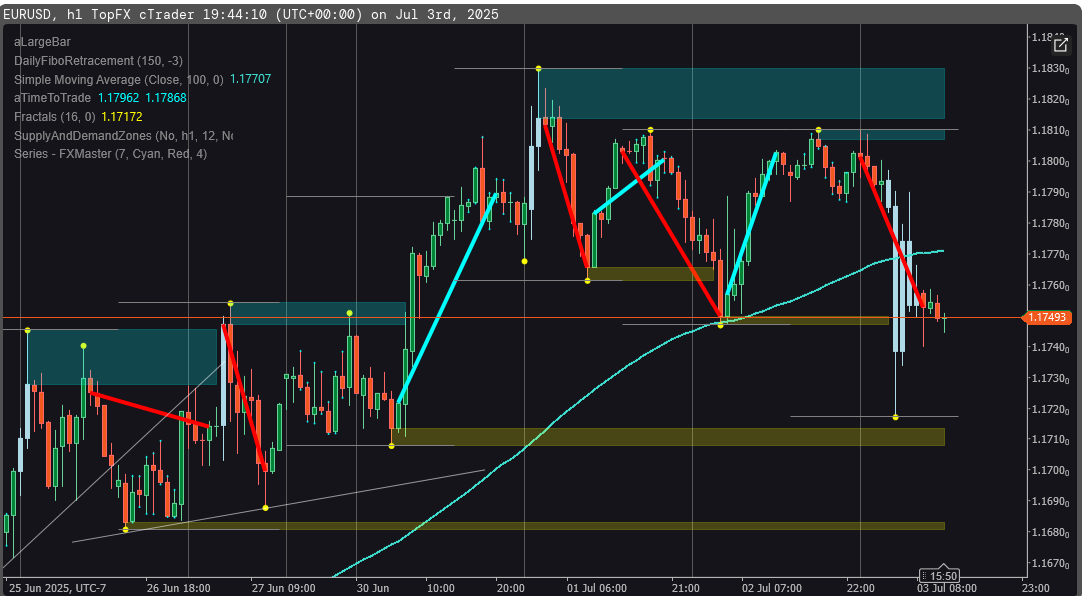
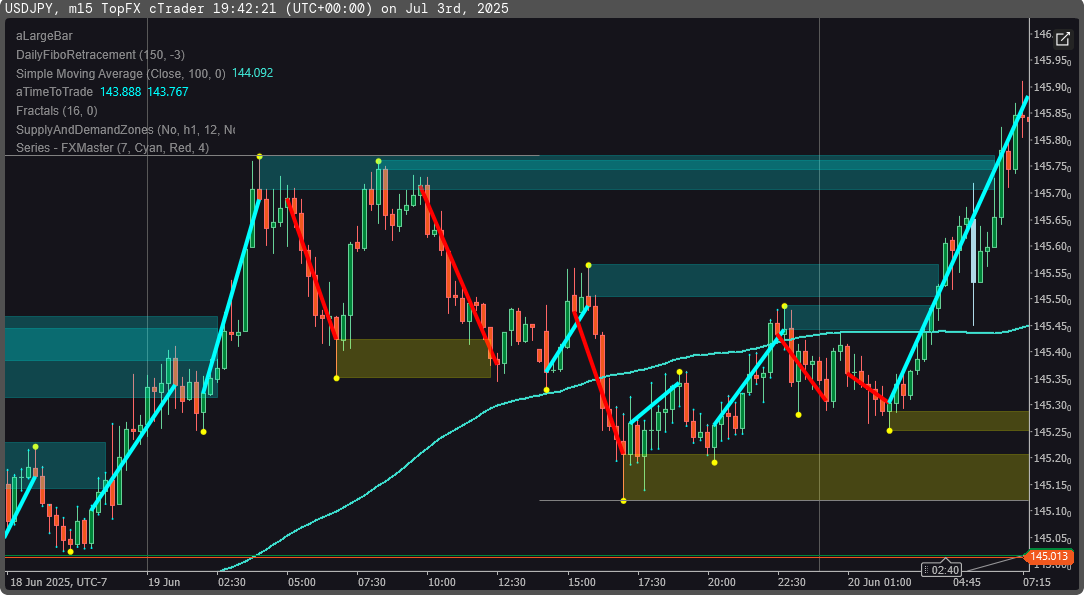
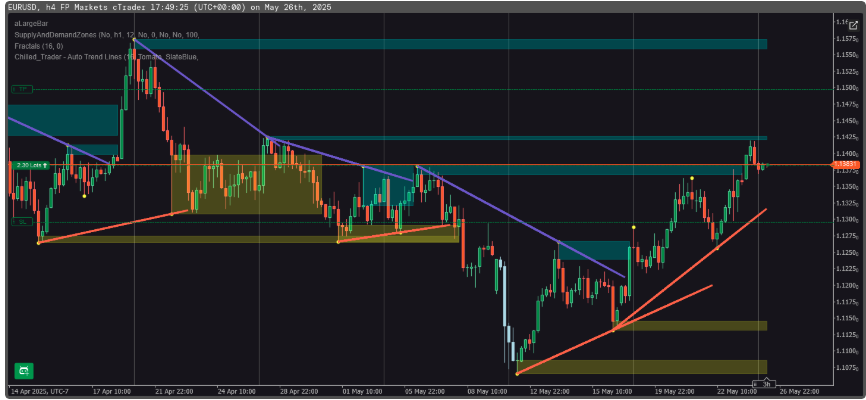
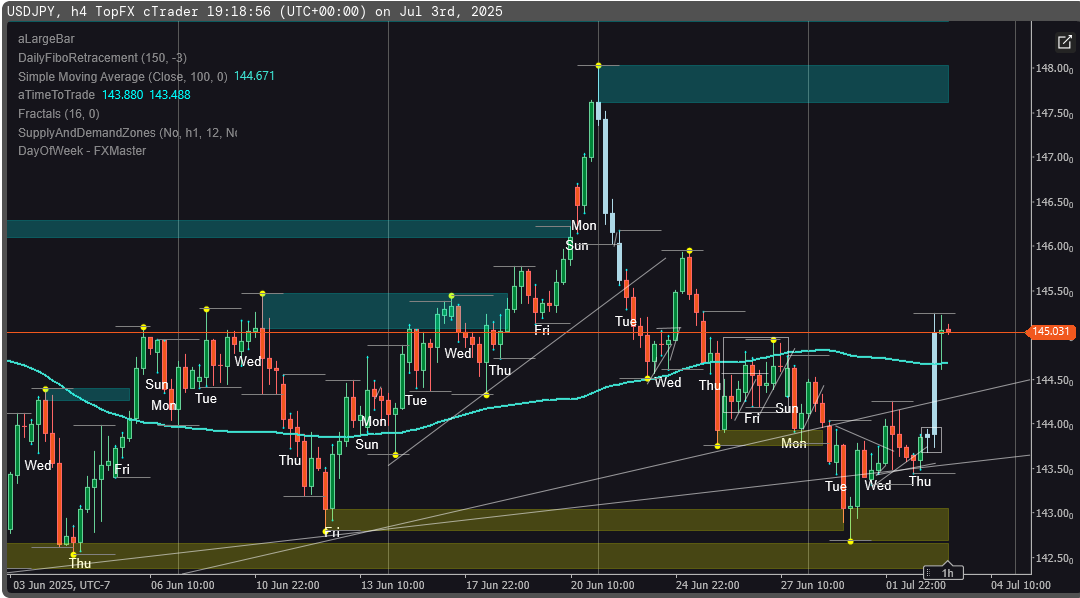
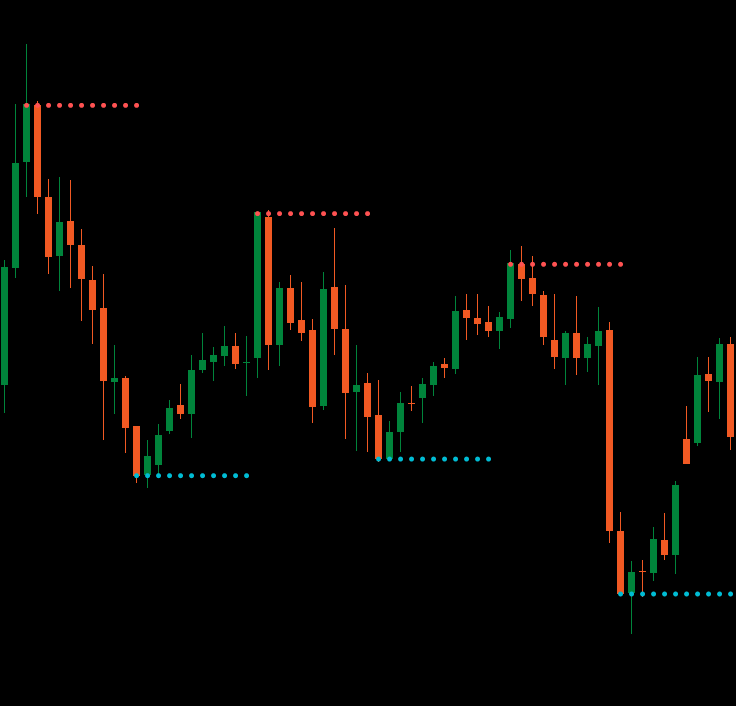
Uncover high-probability trends with precision. The Multi-Symbol Trendlines indicator detects series of Higher Highs / Higher Lows / High Closes or Lower Lows / Lower Highs / Low Closes, giving you clear, customizable insight into uptrends and downtrends—across any market symbol.
🚀 Key Features
- Trend Sequence Detection: Spot bullish or bearish sequences based on consecutive price structure patterns.
- Customizable Thresholds: Set how many bars it takes to confirm a valid trend—dial it in to match your strategy.
- Visual Trendlines: Automatically draws trendlines directly on your chart—color-coded for uptrends and downtrends.
🎯 Who It's For
- Price Action Traders who rely on structure and rhythm over indicators.
- Trend Followers looking for early structure confirmation.
- Multi-Symbol Watchers needing one tool to rule them all.
More from this author
You may also like
!["[Hamster-Coder] Pivot Points" logo](https://market-prod-23f4d22-e289.s3.amazonaws.com/3c48c5d9-506b-4c95-a900-819a312f8649_Icon300.jpg)

 (1).jpg)

.jpg)