ADX and ADI
5.0
19/08/2025
37
Desktop
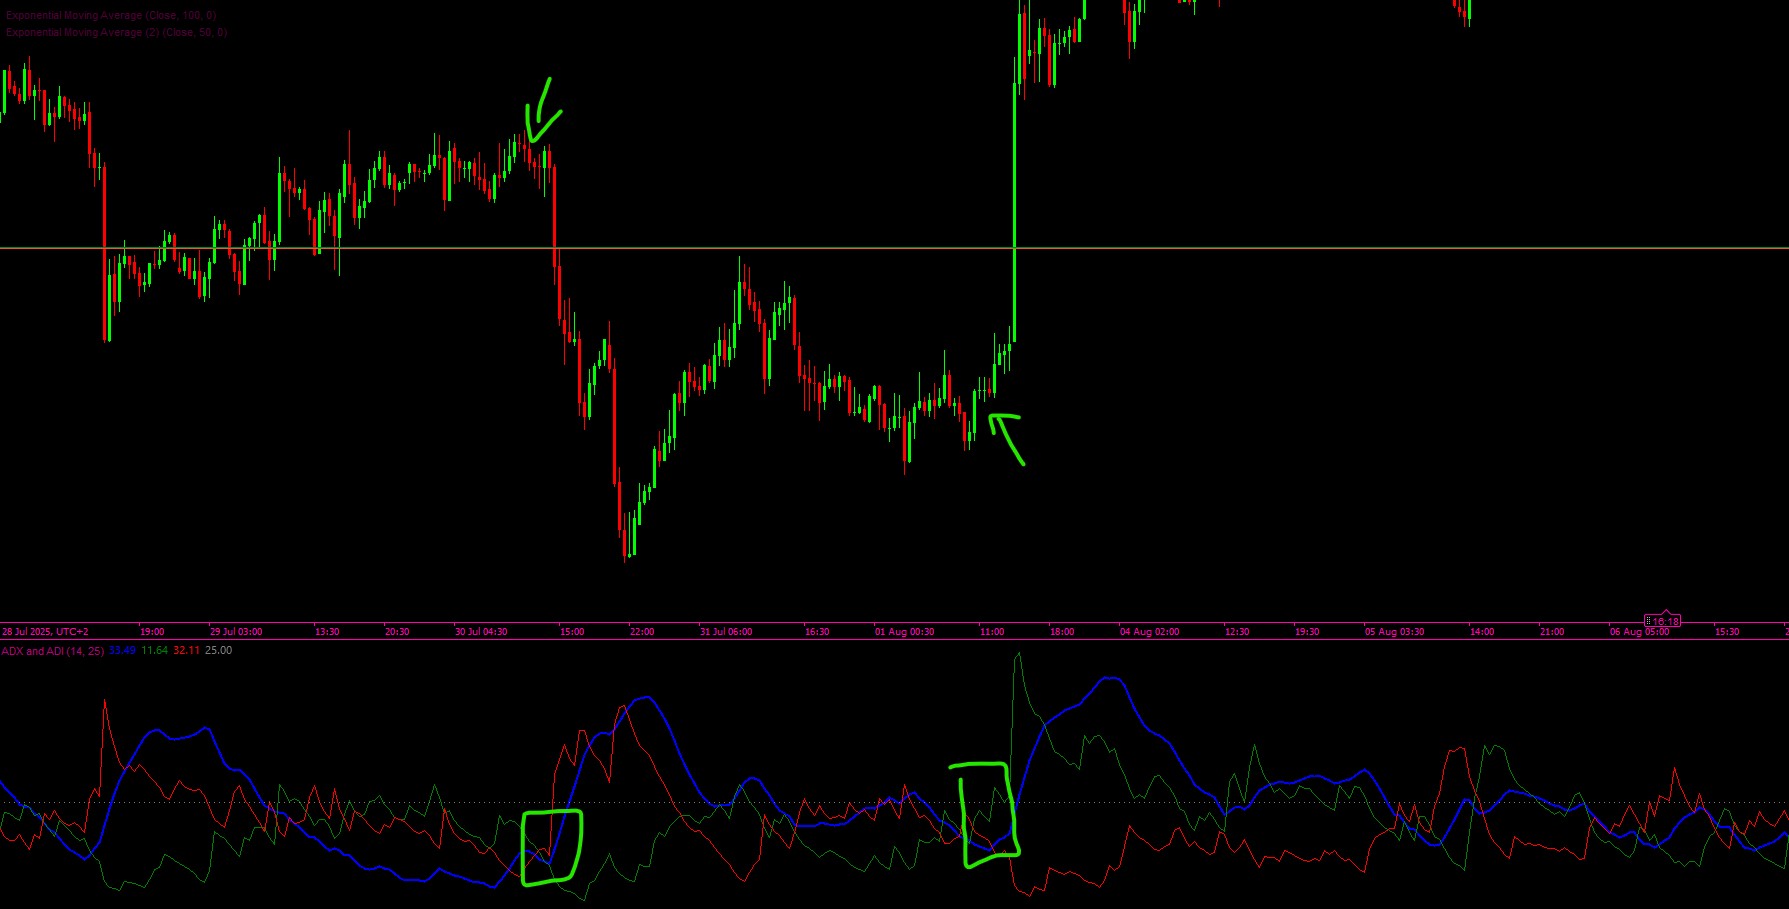
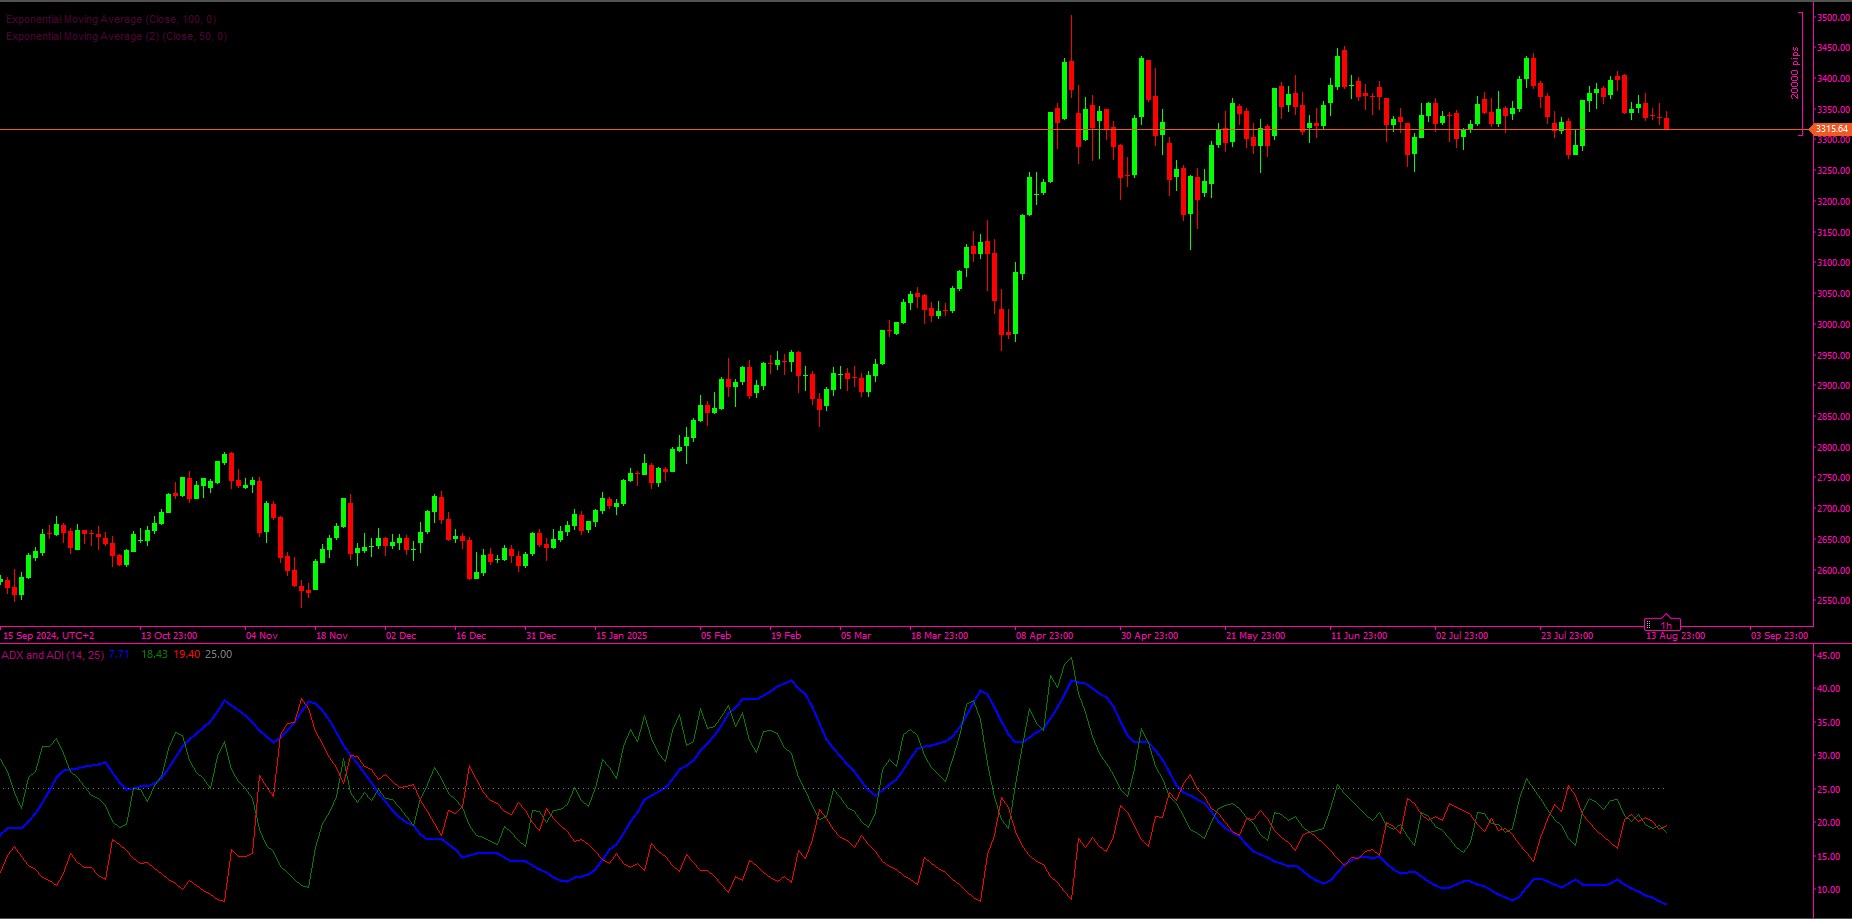
Key Features:
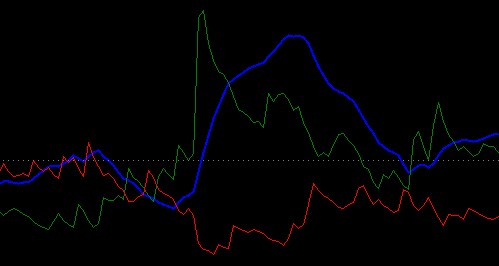
- ADX and ADI Line (Blue): Shows the smoothed strength of the current trend, regardless of direction.
- +DI Line (Green): Indicates the strength of upward movements.
- -DI Line (Red): Indicates the strength of downward movements.
- Threshold Line (Gray): A horizontal reference level (default 25) to help identify whether the trend strength is significant.
How It Works:
- The indicator calculates True Range (TR), Positive Directional Movement (+DM), and Negative Directional Movement (-DM).
- It applies Wilder’s smoothing technique to compute the smoothed values of TR, +DM, and -DM.
- From these, the Directional Indicators (+DI and -DI) are derived, showing which side (bullish or bearish) has stronger momentum.
- The DX (Directional Index) is calculated from the relative difference between +DI and -DI.
- Finally, the ADX (Average Directional Index) is computed as a smoothed version of DX, providing a measure of overall trend strength.
Interpretation:
- When ADX is above the threshold (e.g., 25), the market is considered to be trending strongly.
- When +DI > -DI, bulls are in control (uptrend).
- When -DI > +DI, bears are in control (downtrend).
- When ADX is below the threshold, the market is considered to be ranging (weak or no trend).
More from this author


You may also like
!["[Hamster-Coder] Pivot Points (Demo)" logo](https://market-prod-23f4d22-e289.s3.amazonaws.com/6a1481e2-bd00-4037-bcf0-33495594f95a_Icon300.jpg)
!["[Hamster-Coder] Price" logo](https://market-prod-23f4d22-e289.s3.amazonaws.com/b9c21584-bde2-4113-83c1-d6e5d82a9ca1_Icon300.jpg)
!["[Stellar Strategies] Market Session Ultimate" logo](https://market-prod-23f4d22-e289.s3.amazonaws.com/92b85b76-697c-4a8f-811f-ddd63eb8f9c8_cTrader_oSHtUgCtNJ.png)


Indicator
RSI
SuperEmaColorRSI
This is a super indicator that integrates the RSI indicator with a dual moving average system.