Brokers & props
For business
00
Days
:
00
Hours
:
00
Minutes
:
00
Seconds
Indicator
RSI
Indices
Prop
Commodities
Stocks
Forex
Crypto
SuperEmaColorRSI
22/10/2025
Desktop
Since 30/09/2024
Sales
39
"SuperEmaColorRSI" uploaded image

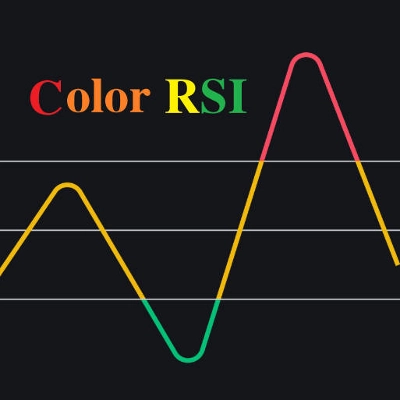
This is a super indicator that integrates the RSI indicator with a dual moving average system. RSI intensity is represented by four colors: red (>70) > orange (>50) > yellow (>30) > green. The dual moving averages use EMA with default parameters set at 48/144, which can be customized according to your needs.

How to use:

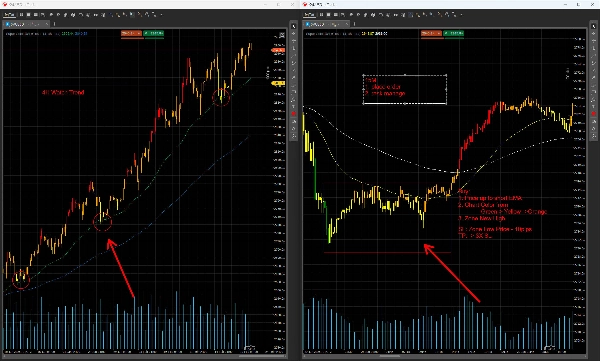
When used in conjunction with multiple time frames (e.g., 4H→15M; 1H→5M, illustrated here using 4H→15M as an example):

  1. Trend identification via dual EMAs (4H timeframe):
    • Upward trend: 48EMA above 144EMA.
    • Downward trend: 48EMA below 144EMA.
    • Range-bound consolidation: The two EMAs are entangled.
  2. Entry/exit points on 15M timeframe:
    • Buy setup (uptrend):
      • Price retraces to the 48EMA on the 4H chart.
      • Switch to 15M: Enter when price breaks above the 15M consolidation range.
      • Stop loss: Set at the recent swing high +10 pips .
    • Sell setup (downtrend):
      • Price retraces to the 48EMA on the 4H chart.
      • Switch to 15M: Enter when price breaks below the 15M consolidation range.
      • Stop loss: Set at the recent swing low –10 pips .
  3. Price divergence signals:
    • Bearish divergence (top):
      • Price makes a new high (on pullback), but the RSI color shifts from red (RSI >70) to orange (RSI >50) .
    • Bullish divergence (bottom):
      • Price makes a new low (on pullback), but the RSI color shifts from green (RSI ≤30) to yellow (RSI ≤50) .

Risk Warning:
No indicator suits all market conditions. Test this strategy thoroughly in a demo environment before applying it to live trading. Improper use may lead to significant losses.

0.0
Reviews: 0
Customer reviews
No reviews for this product yet. Already tried it? Be the first to tell others!
More from this author
Indicator
Indices
Breakout
Prop
+4
Pivot Points Daily Session
Pivot Point with base zone daily Asia-London-New york Session.
Indicator
VWAP
Indices
Prop
+4
Volume Weighted Average Price
VWAP is a powerful tool for intraday traders
Indicator
Indices
Prop
Stocks
+3
IRiskRewardTools
Risk Reward Management Tools(风险回报管理工具)
Indicator
RSI
Indices
Prop
+6
ZigZagColor
The ZigZag indicator is a technical analysis tool primarily used to identify key price reversal points.
Indicator
Indices
Breakout
Prop
+4
Higher TimeFrame Candle Tracker
Higher TimeFrame Candle Tracker: Current Timeframe (Any TimeFrame) Show High TimeFrame Candle Bar
Indicator
Indices
Breakout
Commodities
+3
Daily Levels
The "Daily Levels" indicator is used to display last week's and yestoday high/low price
You may also like
Indicator
NAS100
NZDUSD
Breakout
+14
Adaptive Trailing System
🚀 Adaptive trailing stop that uses logarithmic normalized volatility....
Tiny_Aim_Trainer
trading stress-relief “mini-game”
E7 cTrader User ID
cTrader ID
Indicator
RSI
Breakout
XAUUSD
+5
Shielded Trend
Buy/Sell signals filtering noise, color-coded trends & strength shield 🛡️. Trade only with POWER ⚡
xhobaniFX_ADR-Lines
xhobaniFX_ADR-Lines: Average Daily Range Horizontal Lines
IR Spread
show spread on chart
Indicator
RSI
Breakout
XAUUSD
+5
Supertrend
💹 Define a price channel 📈 and determine trend direction (bullish 🟢 or bearish 🔴).
Time To Break Even Lite Version
This is the trial version of Time To Break Even, which help you time your trade entry.
E7 Correlation Dashboard
E7 Correlation Dashboard.
Retro_Shooting_Game
trading stress-relief “mini-game”
Indicator
Indices
Breakout
XAUUSD
+6
TMAX RBA 2026 ULTRA
🚀 TMAX RBA Indicator - The Ultimate Multi-Timeframe Momentum System 🚀
SmartBot-MCDX Indicator
MCDX is a powerful and innovative indicator.
Fx4U.Multi Trend Line Indicator
Allow trader to draw multi trendlines in different timeframes on one chart,Give trader an overview of the current market
SmartLiquidityZonesPRO
Smart Liquidity Zones PRO auto-detects liquidity grabs, wicks, traps & manipulations — trade like the smart money.
Indicator
Indices
Prop
Stocks
+3
VegaXLR - Unlimited Trendline Alerts
This is an indicator that can alert you about trendlines, horizontal lines and vertical lines.
Indicator
NAS100
NZDUSD
XAUUSD
+12
Cosmic Decision System Pro
Decision System Indicator According to Cosmic Laws
Indicator
NAS100
NZDUSD
XAUUSD
+8
Squeeze Breakout Regression System
💥Detects moments when the market is "compressed" and about to explode in any direction 💥
Indicator
Grid
NAS100
NZDUSD
+15
TS_Pivot
Those who are involved in trading know how important it is to take into account the previous session. With Order Block