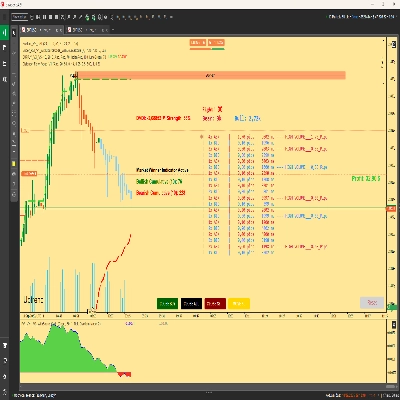
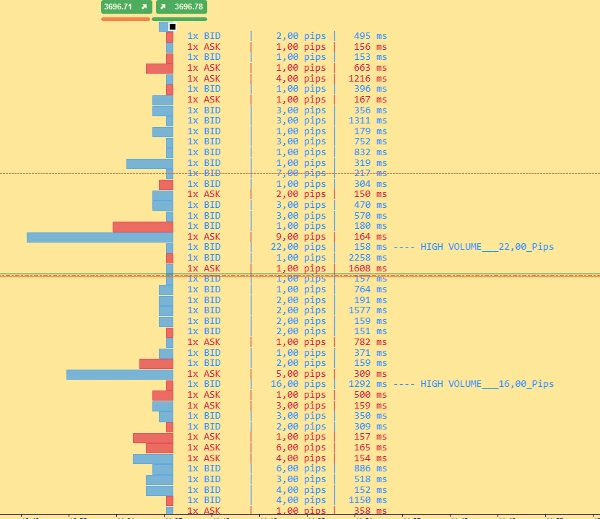
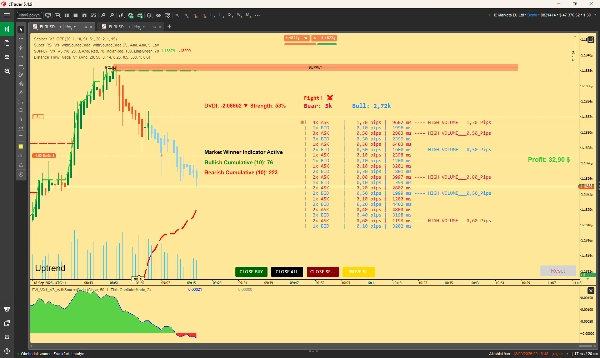
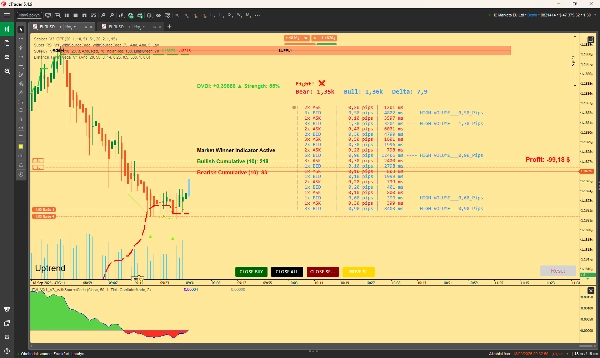
"ORDERFLOW_SKIA_Plynuly" logo
ORDERFLOW_SKIA_Plynuly
"ORDERFLOW_SKIA_Plynuly" uploaded image
Since 09/01/2025
10.14K
Free installs

This Indicator will show you Direction, Distance, and Time; Use this indicator exactly at support and resistance zones to see who the winner is. You will see many high volume texts , while there is bid high volume and bear high volume, do not enter, wait until it calms down and watch where the price is going , the winner is a Bear or Bull? You will see :-) . This indicator will not give you pure buy sell signals, it will give you much more, give to it a time , watch what is happening on chart and watch my indicator and you will soon realize they way to earn some cash is not that hard. Have a nice day. If this Indicator proves useful , i have also much better and polished version with much more signals, and informations. Latest version + Source = $5000 Usd

Indicator profile
0.0
Reviews: 0
Customer reviews
No reviews for this product yet. Already tried it? Be the first to tell others!
BTCUSD
Forex
Signal
Breakout
Indices
EURUSD
Commodities
GBPUSD
NZDUSD
Prop
Scalping
Crypto
Stocks
XAUUSD
NAS100
USDJPY
Products available through cTrader Store, including trading bots, indicators and plugins, are provided by third-party developers and made available for informational and technical access purposes only. cTrader Store is not a broker and does not provide investment advice, personal recommendations or any guarantee of future performance.

More from this author

Cumulative delta candles + volume profile
Support and Resistance.
Scalpers Volume Profile
Volume Profile Supply Demand
Supply and Demand Zones
Robust Cumulative delta,Atr and imbalance indicator.
TAPE READER :-)
Break Out Probability Experimental indicator. Credits for this indicator goes to Zeiierman !!!
Demo of my main indcator.
Multi Timeframe Candle drawing. Draw Any candles from any timeframe on your chart :-)

You may also like

Fair Value Gap (FVG)
Trades Opening Range Breakouts Indicator with dynamic stops/targets adapting to market volatility.
"BarCount" logo
4.5
(2)
Free
Bar count
Daily moving averages, simplified. Displays 3 daily moving averages on lower timeframes with selectable MA types.
MultiFrameCandles para cTrader: La Herramienta Definitiva para Dominar Cualquier Marco de Tiempo
The Pressure Gap indicator identifies sudden price jumps without using volume.
This indicator combines RSI (Relative Strength Index) with volume analysis to generate more reliable trading signals.
Visually master the Inside Bar strategy with clear breakout signals and professional chart highlighting 📈🔔📉
Bollinger Band Cloud, Heiken Ashi, Trend Follower and Parabolic SAR.
The Red & Green Zone Reversal Indicator detects overbought and oversold market conditions using Bollinger Bands and RSI.
Bar Time Timeframe / Renko
ICT Order Block Advanced
Optimize exits with Chandelier Exit! Visualize stop-loss points dynamically for improved trading precision and safety.
multi time frame moving averge. you could choose different type of price like median ,high and ... and differnt type of
Candle Timer & Strength DEMO for cTrader This is a DEMO version of the Candle Timer & Strength indicator. You can use al
📈 Adaptive ALMA-Gaussian hybrid trend filter with precision smoothing and clear buy/sell signals.
The long awaited new and improved Supply Demand Premium V2 indicator. Unlock greater trading opportunities now!
Engulfing Pattern Indicator
Since 09/01/2025
10.14K
Free installs