.jpg)
.png)
.png)
.png)
.png)
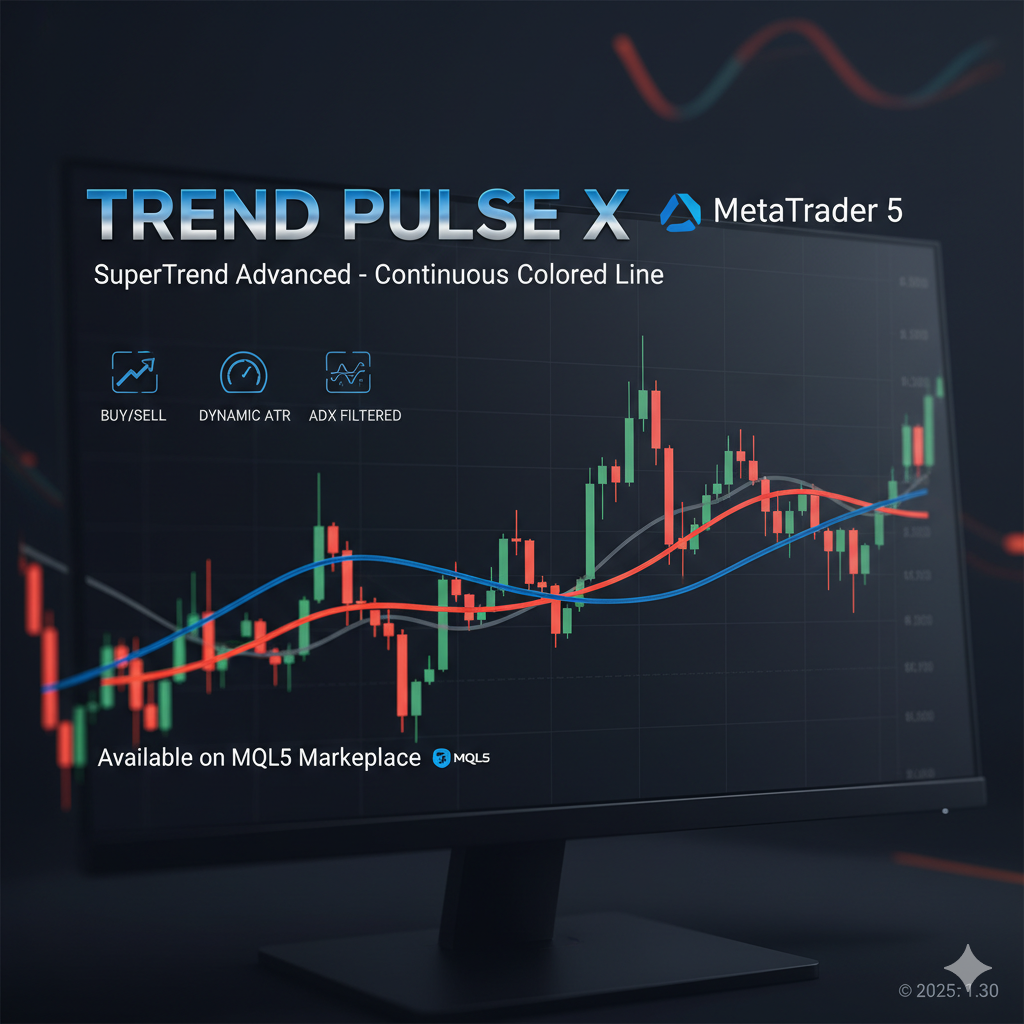
Trend Pulse X
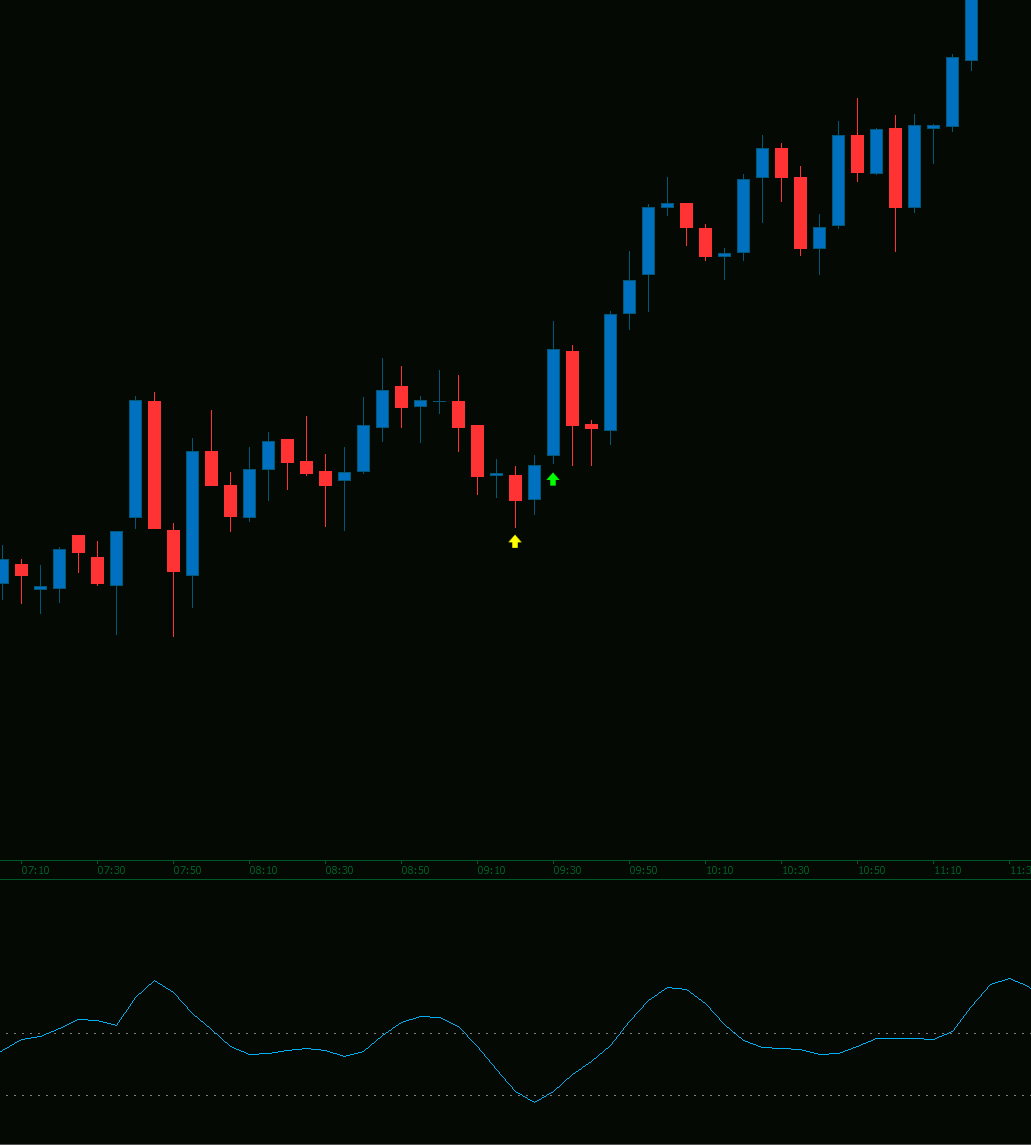
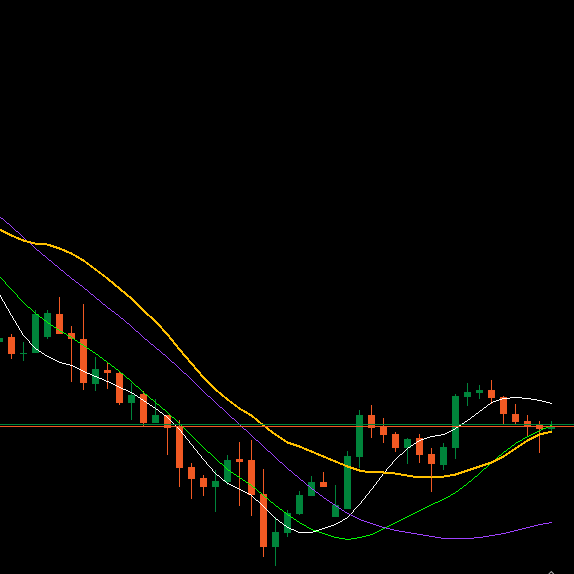
The Trend Pulse X is a trend-following indicator designed to provide a clear view of market direction, momentum, and strength. Unlike indicators that may display irregular signals, this tool produces a continuous, adaptive line that responds dynamically to price action, offering a consistent reference on the chart.
How it works
The indicator combines two analytical concepts:
ATR (Average True Range): measures volatility. Higher ATR values increase the spacing between price and the indicator line, reflecting stronger swings.
ADX (Average Directional Index): measures trend strength. When ADX is below a chosen threshold (default = 25), conditions are considered weaker or ranging.
By combining these factors, Trend Pulse X highlights both the direction of price movement and the relative strength of the underlying trend.
Color-coded interpretation
Blue line: indicates a strong upward trend.
Red line: indicates a strong downward trend.
Gray line: indicates weaker or sideways conditions.
The continuous line shifts color automatically, helping users quickly interpret market phases.
Reading the indicator
A blue line positioned below price suggests upward momentum.
A red line positioned above price suggests downward momentum.
A gray line suggests consolidation or indecision.
The line can also serve as a dynamic reference for support/resistance or as a trend filter within broader strategies.
Key features
Continuous, gap-free design for smoother chart interpretation.
Integration of ATR and ADX for combined volatility and trend analysis.
Dynamic color coding for quick recognition of market phases.
Usable across different trading styles (scalping, intraday, swing).
.png)
.jpg)
!["[Stellar Strategies] Market Session Ultimate" logo](https://market-prod-23f4d22-e289.s3.amazonaws.com/92b85b76-697c-4a8f-811f-ddd63eb8f9c8_cTrader_oSHtUgCtNJ.png)

!["[Hamster-Coder] Pivot Points" logo](https://market-prod-23f4d22-e289.s3.amazonaws.com/3c48c5d9-506b-4c95-a900-819a312f8649_Icon300.jpg)