Indicator
RSI
Indices
Forex
Crypto
Candle Pro
"Candle Pro" logo
04/10/2025
2
Desktop
Since 24/02/2025
Free installs
43
"Candle Pro" uploaded image"Candle Pro" uploaded image"Candle Pro" uploaded image"Candle Pro" uploaded image"Candle Pro" uploaded image

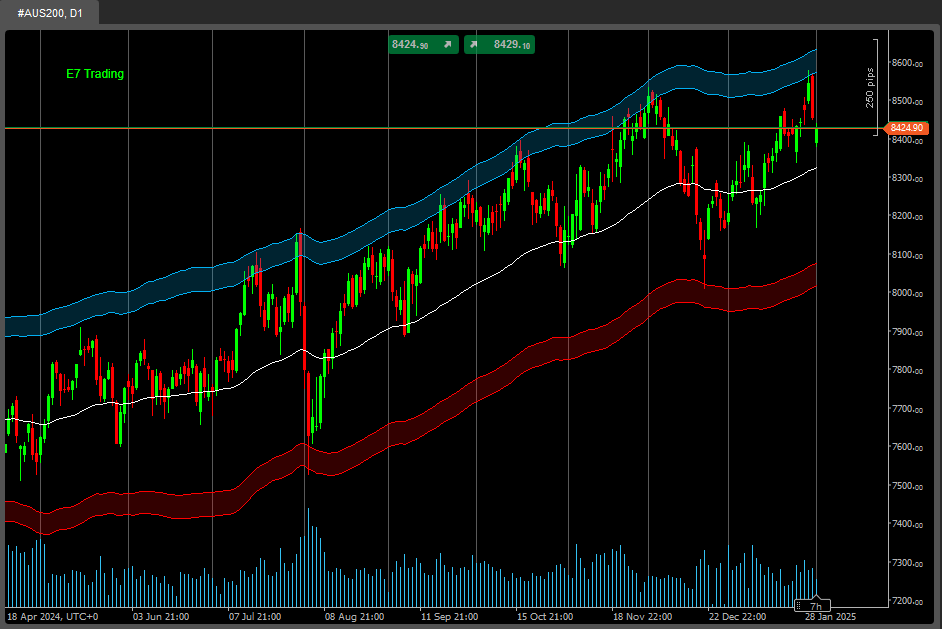
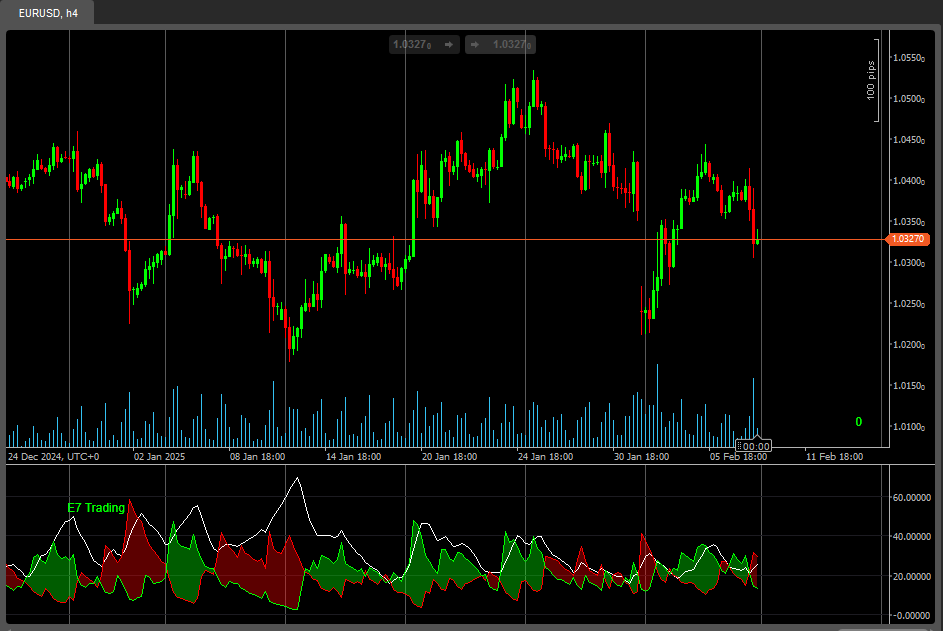
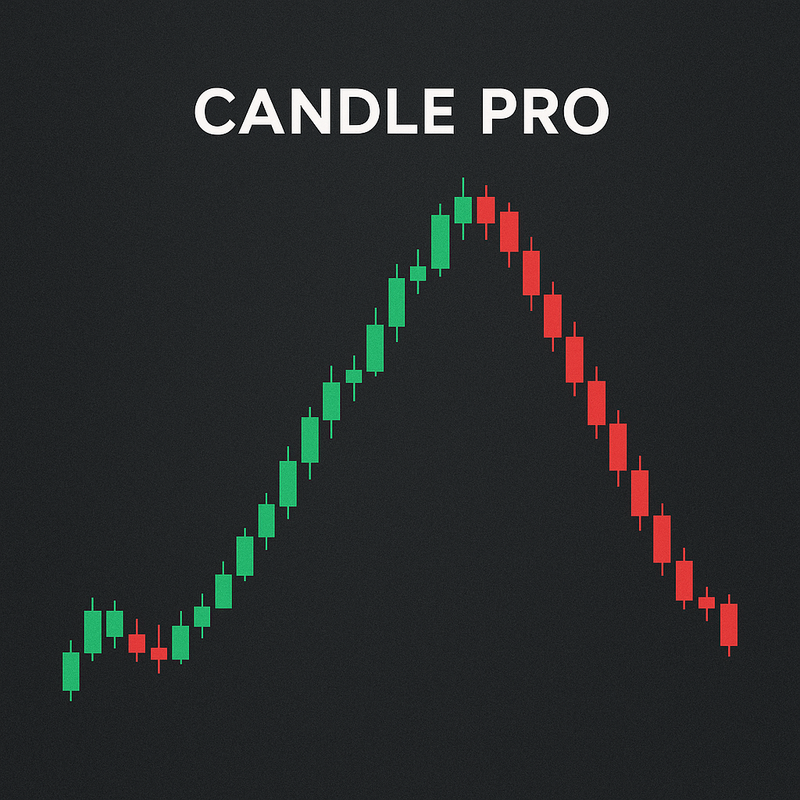
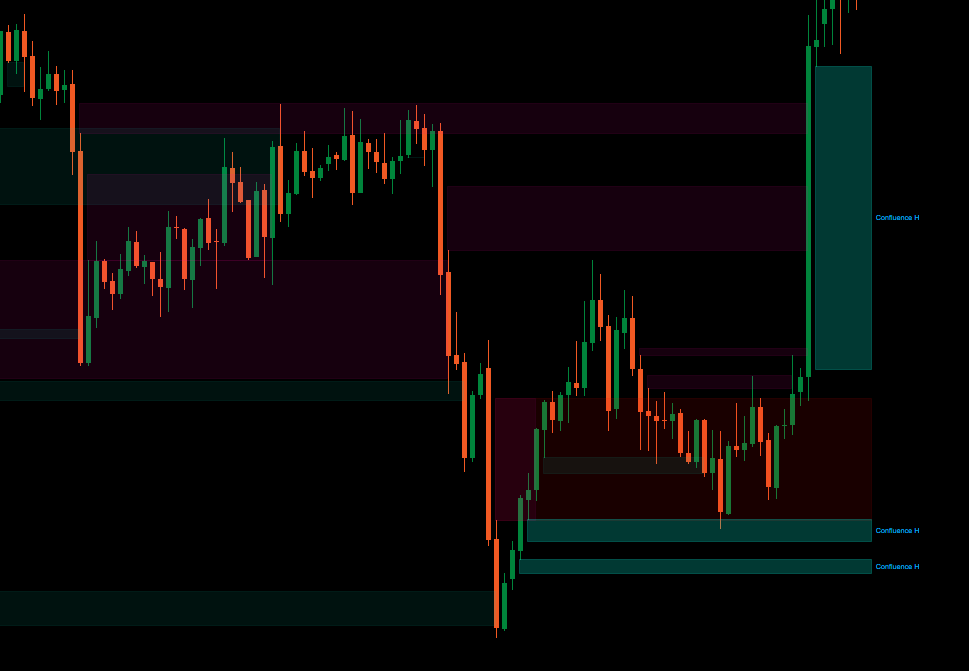
Candle Pro – Visual RSI signals on candles

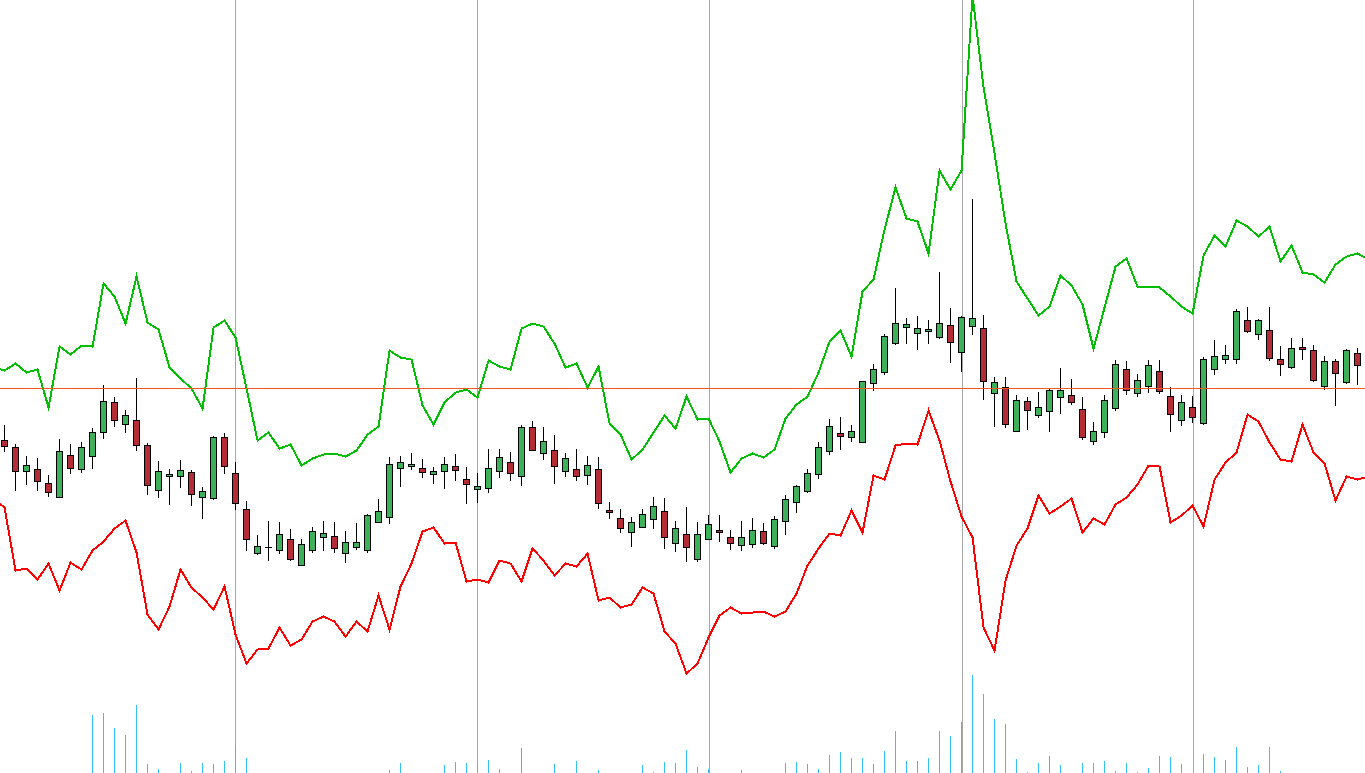
Candle Pro is an indicator that highlights candles directly on the chart when RSI reaches overbought or oversold levels, keeping your focus on price action and avoiding extra sub-charts.

🧭 How to use

  1. Add the indicator to your chart.
  2. Adjust the RSI parameters to fit your trading style.
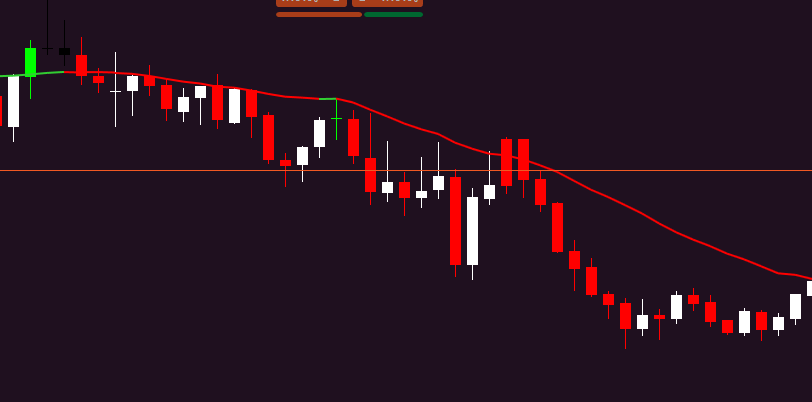
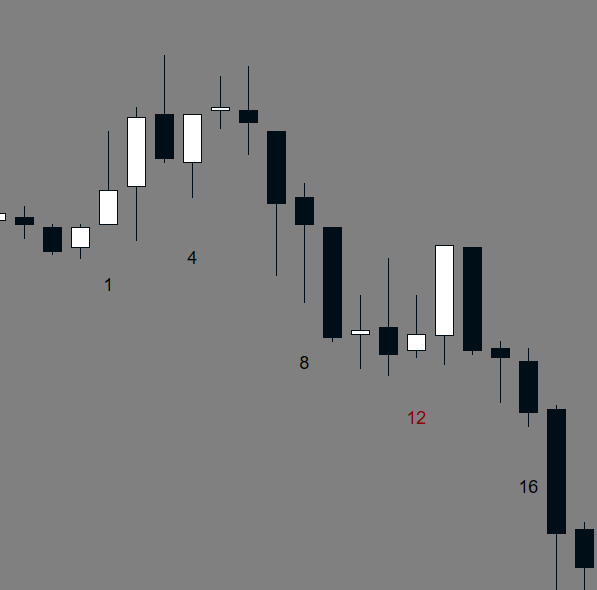
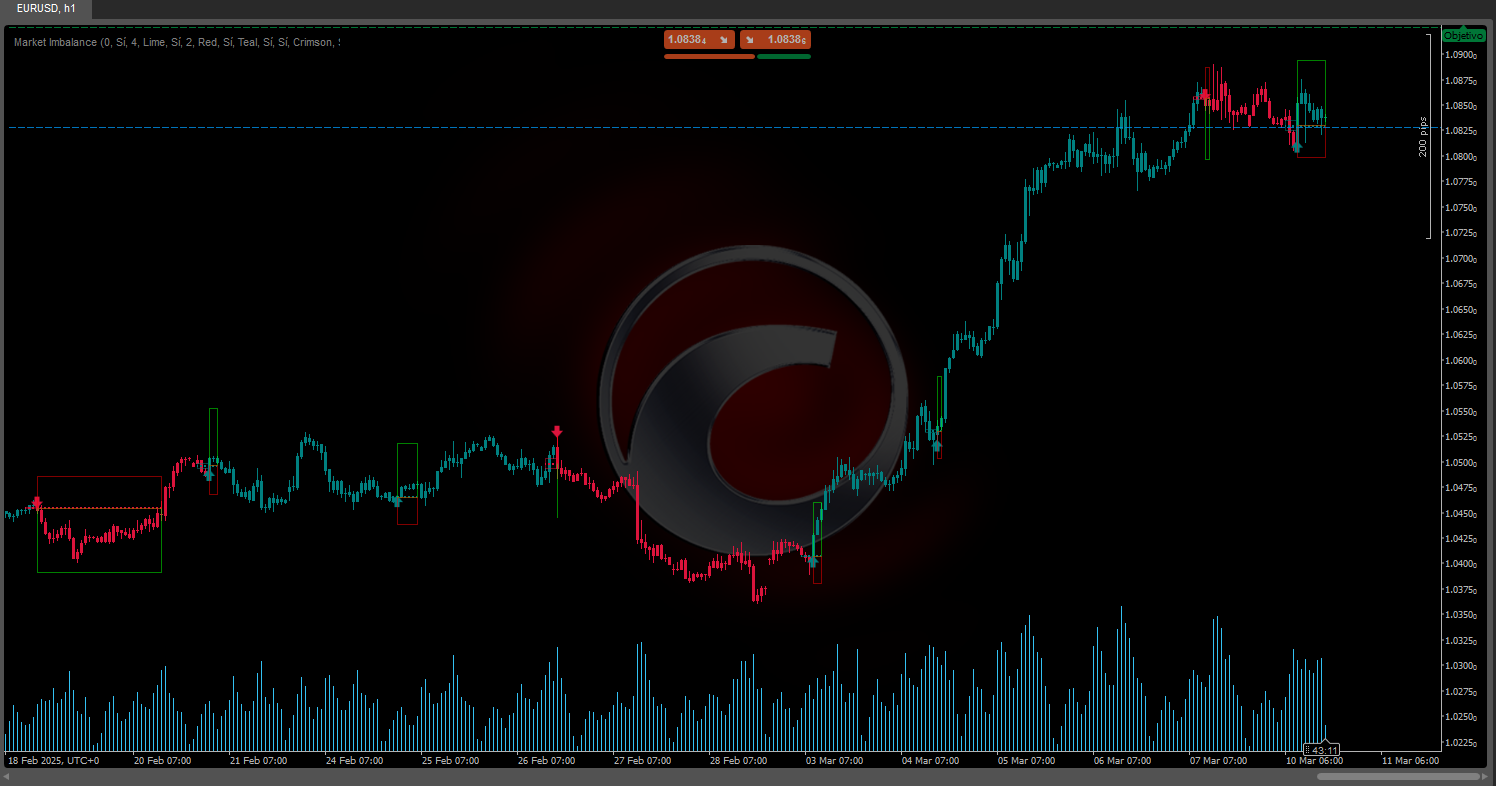
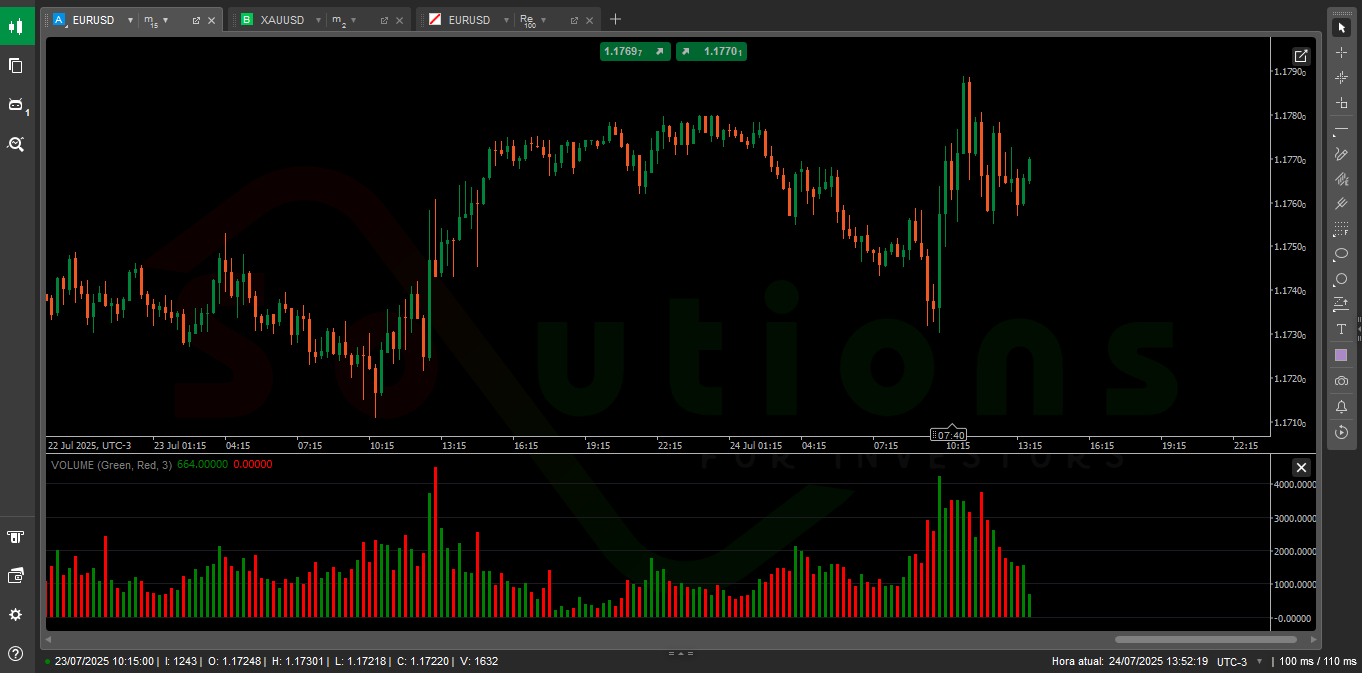
  3. Watch how candles change color at extreme levels, marking potential reversal or momentum zones.

⚙️ Suggested settings

For a fast and precise response:

  • RSI Period: 3
  • Overbought: 32
  • Oversold: 44
  • Candle Width: 3
  • Bar Width: 1

Benefits

  • Clean visual signals directly on price.
  • Works with any symbol and timeframe.
  • Fully customizable colors and line widths.
  • Perfect for scalping, intraday, and swing trading.

Note: This is the free version of Candle Pro. A premium version is coming soon, packed with exclusive features to take your trading to the next level.

More from this author
Indicator
Indices
Breakout
Forex
+2
Time zone pro
FREE Global Trading Sessions Indicator
You may also like
Free Volume Profile v2.0
Indicator
RSI
XAUUSD
Breakout
+6
Market Imbalance
Identifies market imbalances and visually marks key areas based on price patterns and volatility (ATR).
VolumeColorBar
Color Volume Bars – Visualize Market Strength Instantly
Indicator
Indices
Commodities
Forex
Institutional FVG Zones MTF with Confluence
Professional Fair Value Gaps with multitimeframe spot on
Indicator
RSI
Indices
Signal
+2
[Stellar Strategies] Ultimate Trend & Momentum Dashboard
A comprehensive cTrader indicator designed to give you a quick, at-a-glance understanding of market sentiment 📈📉
Indicator
Signal
MACD
TradingViewMACD
Enhance your trading strategy with our customizable TradingViewMACD indicator. Optimize and elevate your market analysis
E7 Polynomial Regression Channel
Polynomial Regression Channel which also reflects the volatility of the underlying asset.
Indicator
NAS100
NZDUSD
XAUUSD
+10
Tsunami Volume Surge - RVOL
🌊 See when the market is truly in play. Tsunami measures Relative Volume by time-of-day 🌊
BarCount
Bar count
SmartFibonacci
SmartFibonacci — automatic Fibonacci retracements & extensions with swing detection, alerts and clean labels for cTrader
Indicator
NAS100
NZDUSD
Breakout
+12
RT ATR Bands
Enhance trading with ATR Bands! Visualize market volatility using dynamic upper and lower ATR bands for precise decision
Indicator
XAUUSD
Commodities
True Open Pivot Levels
This indicatorFull Description: Th shows the open price lines at key market times based on Eastern Standard Time (EST).
Indicator
Bollinger
E7 Indicators Free Studies
ADXR, KDJ, SineWave, Bollinger Band Volatility and AEOscillator.
Indicator
Indices
Stocks
Commodities
+2
Series - FXMaster
Consecutive Series Moves — Reveal the True Pulse of Price Action
Indicator
Indices
ATR
Stocks
+4
UT Bot Alert
A powerful ATR-based indicator generating clear BUY/SELL signals. Features real-time alerts and customizable sensitivity
ICT MACRO THEORY
Are essentially short intervals during which the algorithm seeks liquidity or adjusts price.....
Indicator
Indices
RSI
Stocks
+3
Advanced RSI Indicator
Advanced RSI Indicator with multi-MA smoothing, Bollinger Bands, divergence detection, and fill zones for cTrader.