"RT VWAP" logo
RT VWAP
0.0
03/09/2025
2
Desktop
"RT VWAP" uploaded image"RT VWAP" uploaded image"RT VWAP" uploaded image

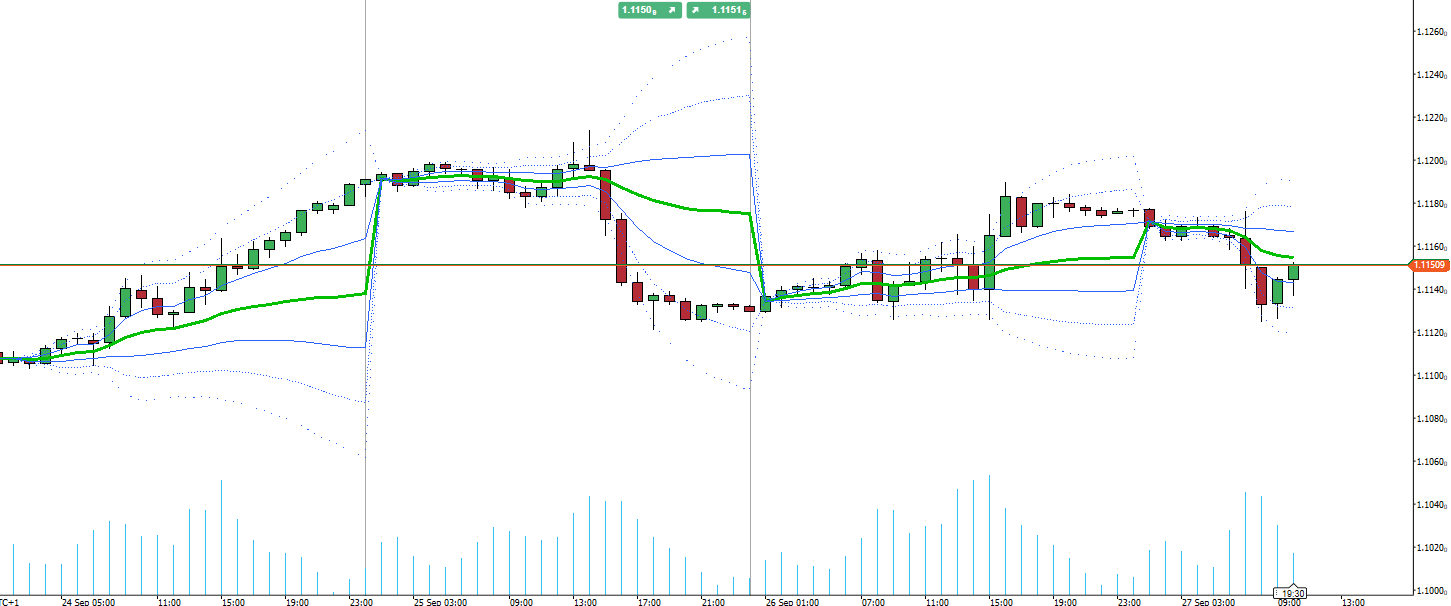
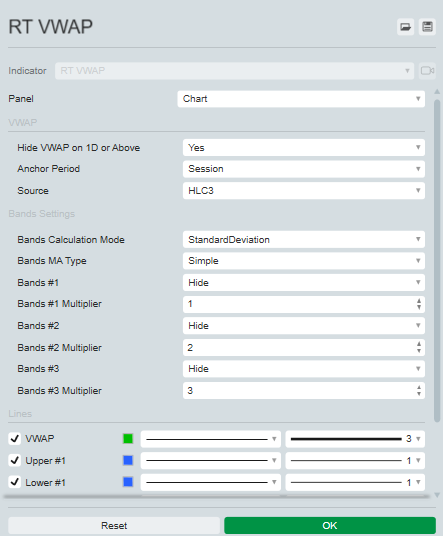
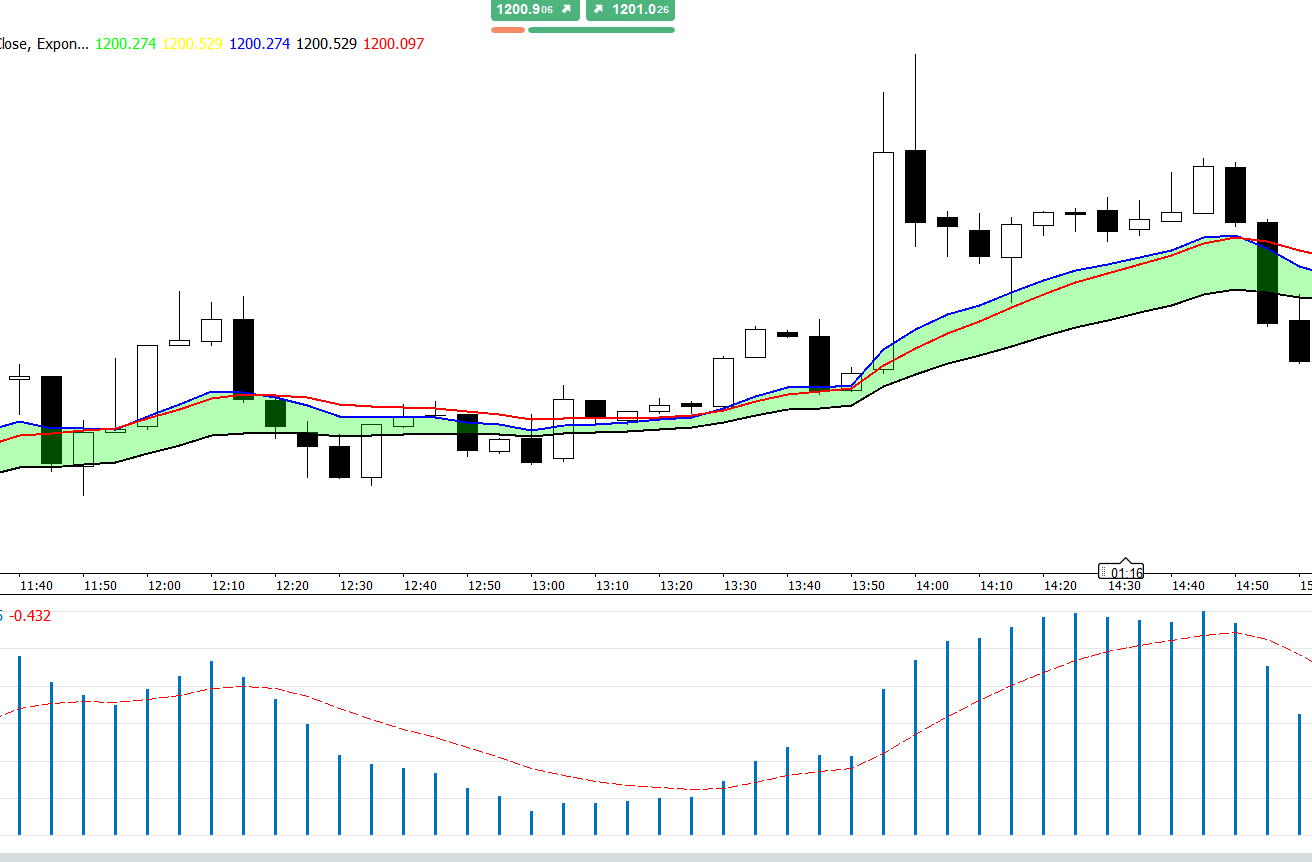
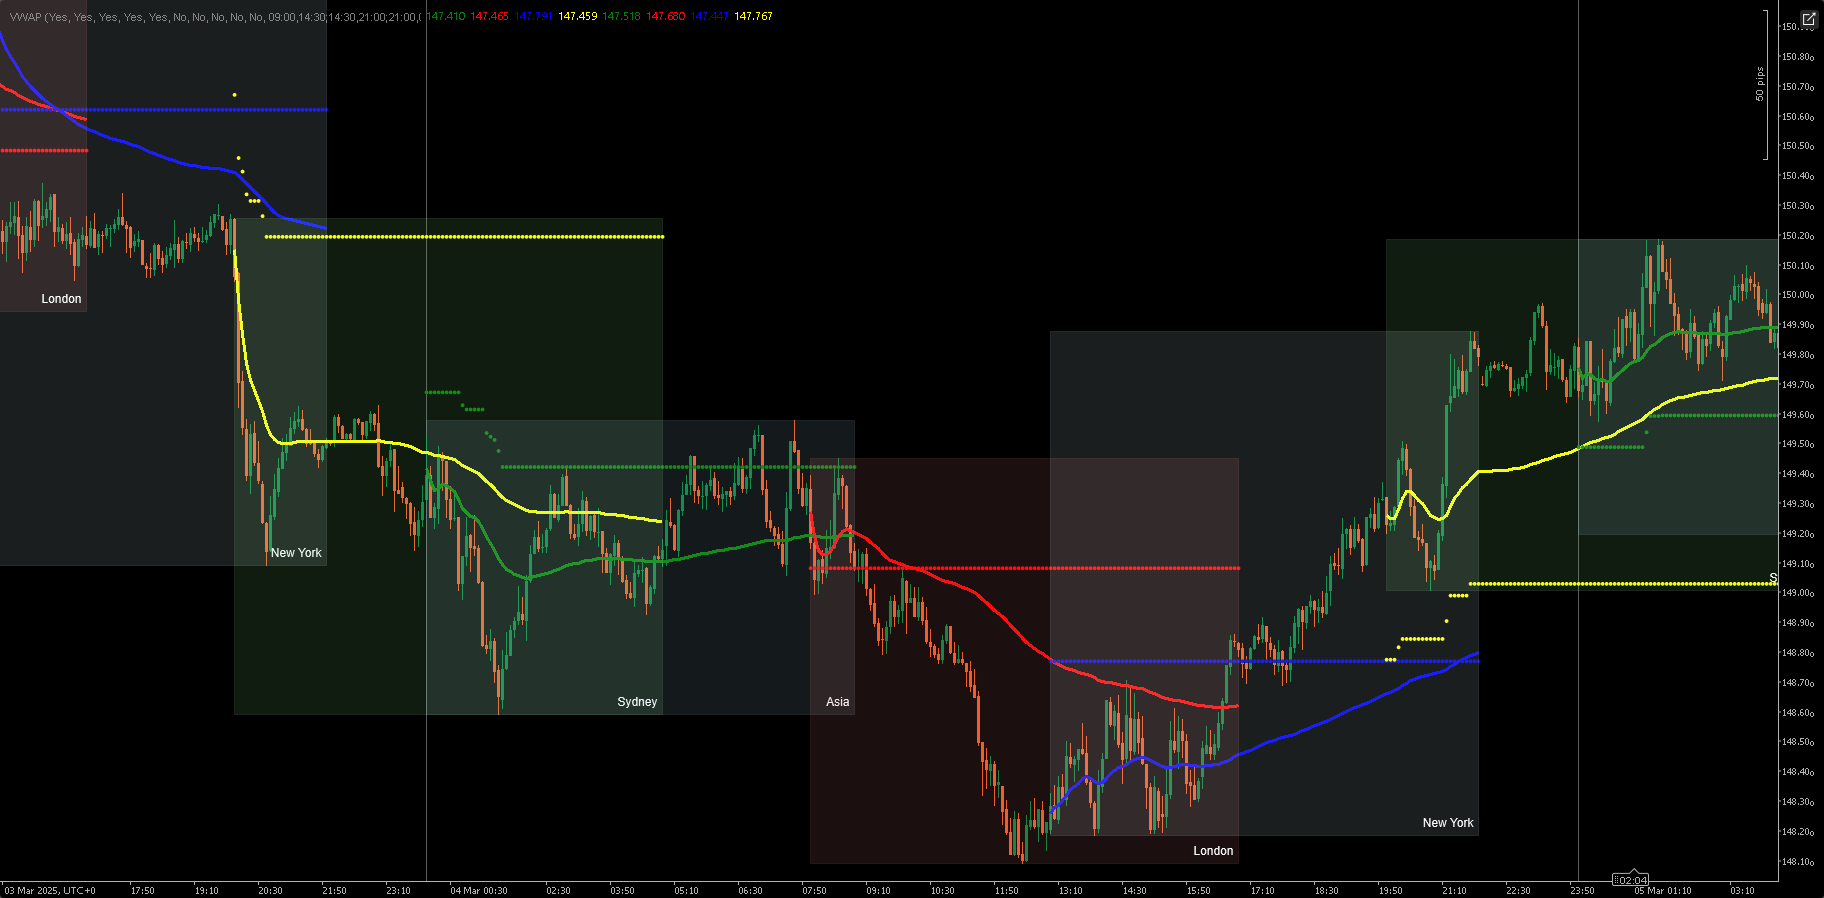
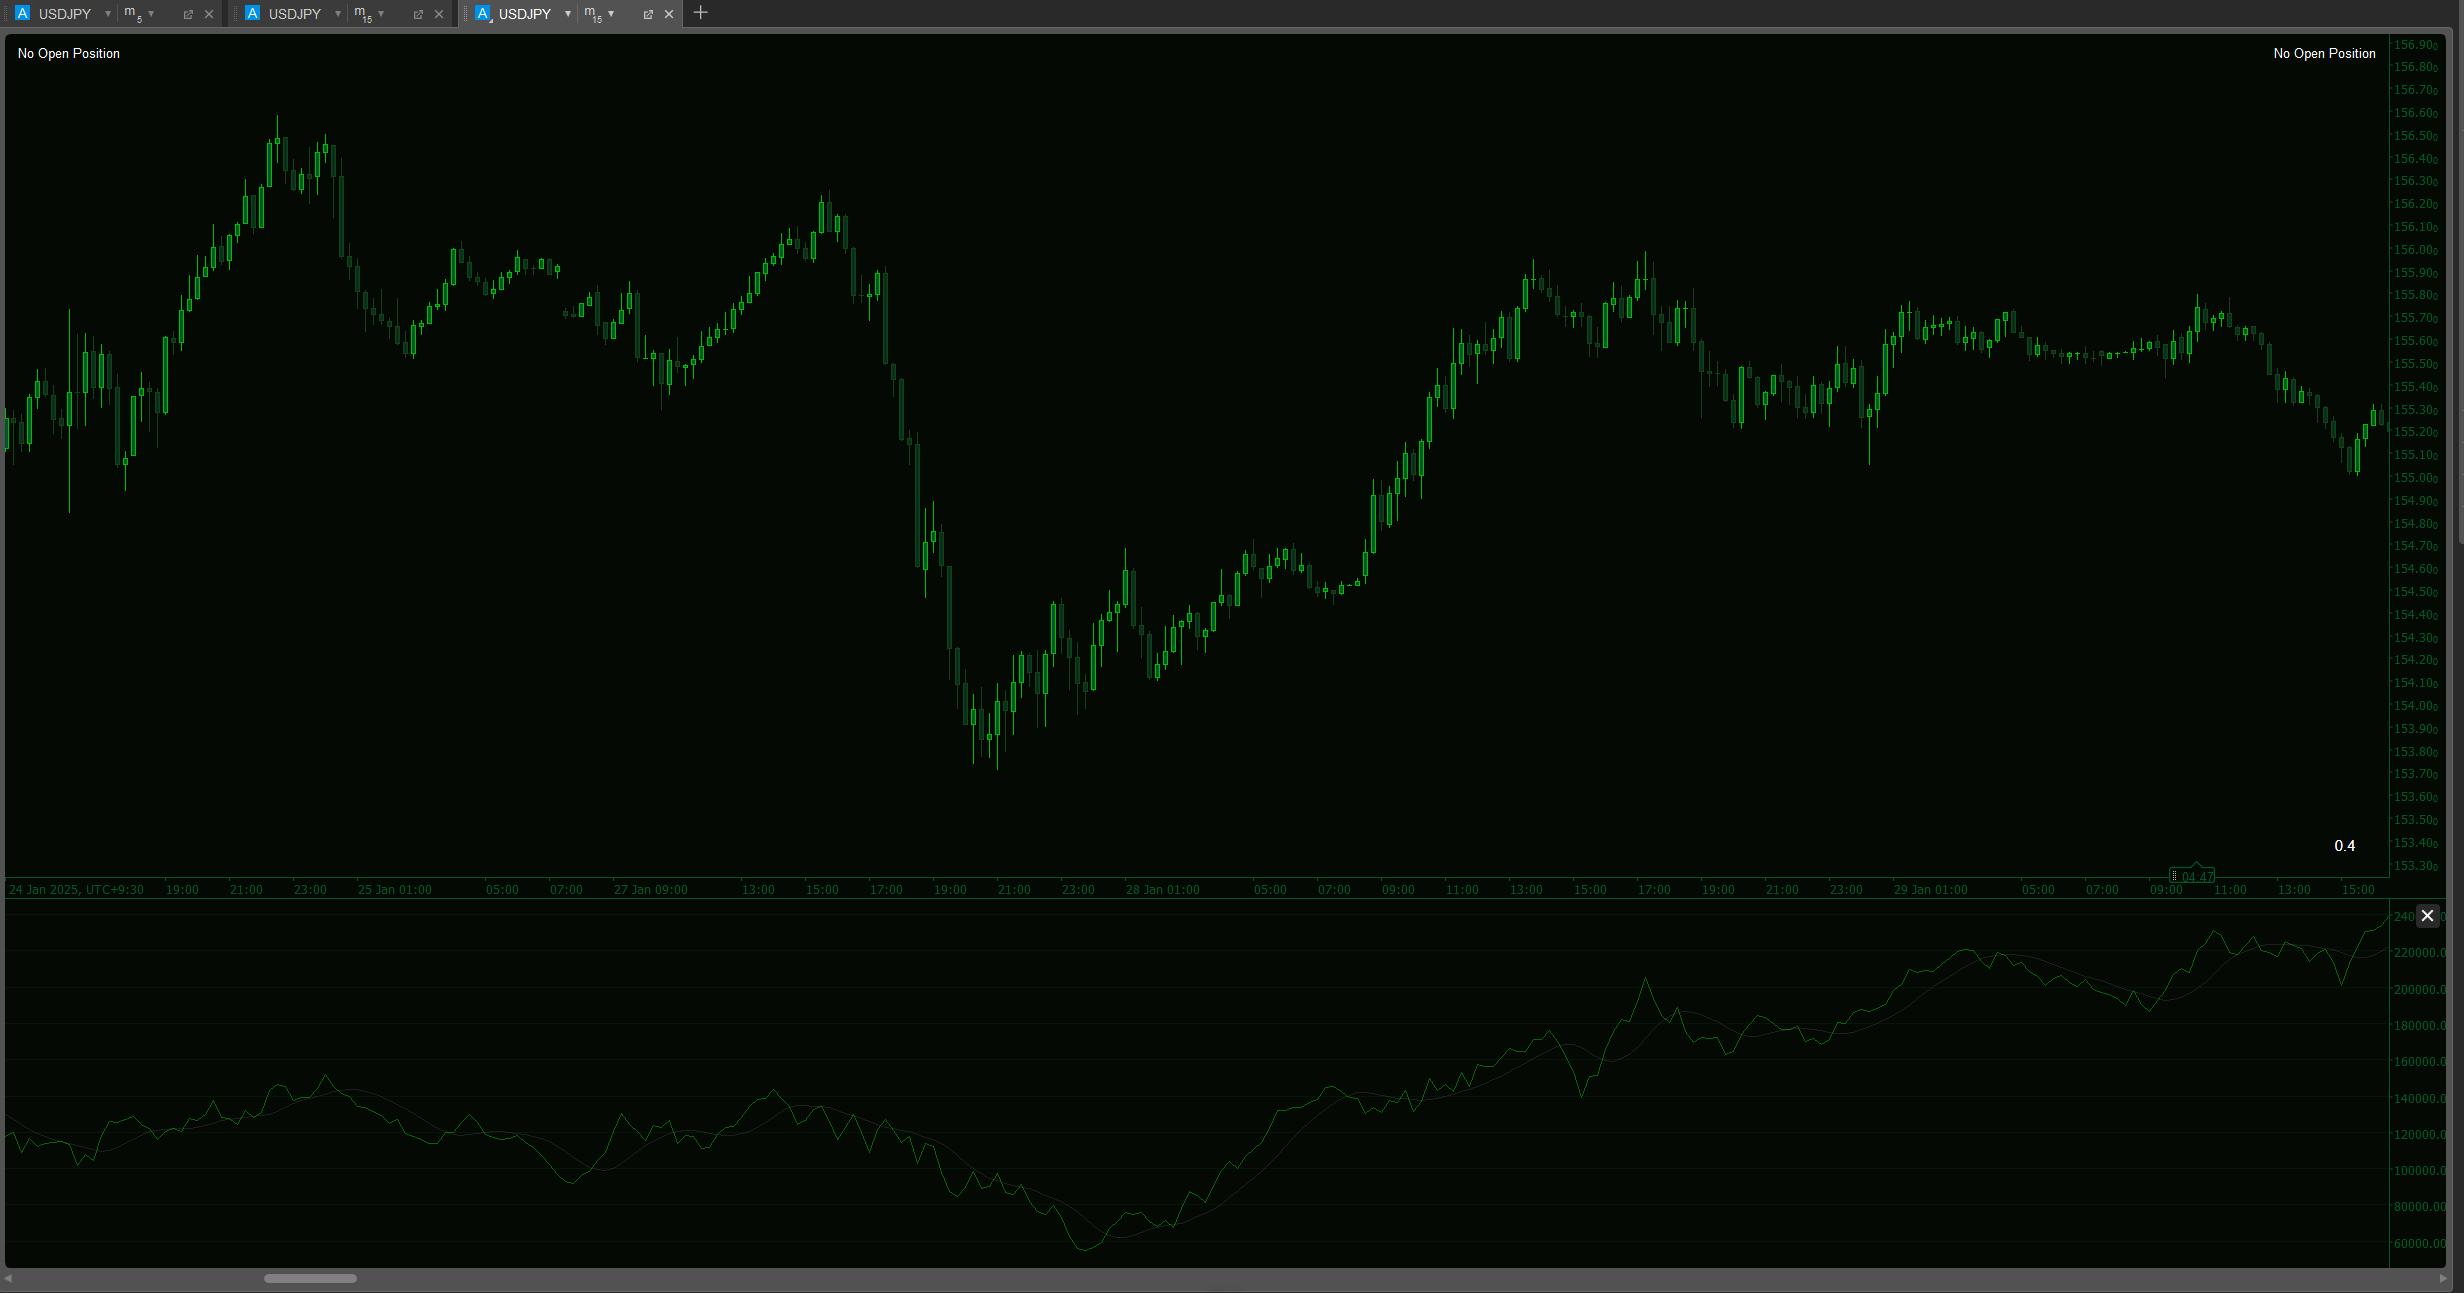
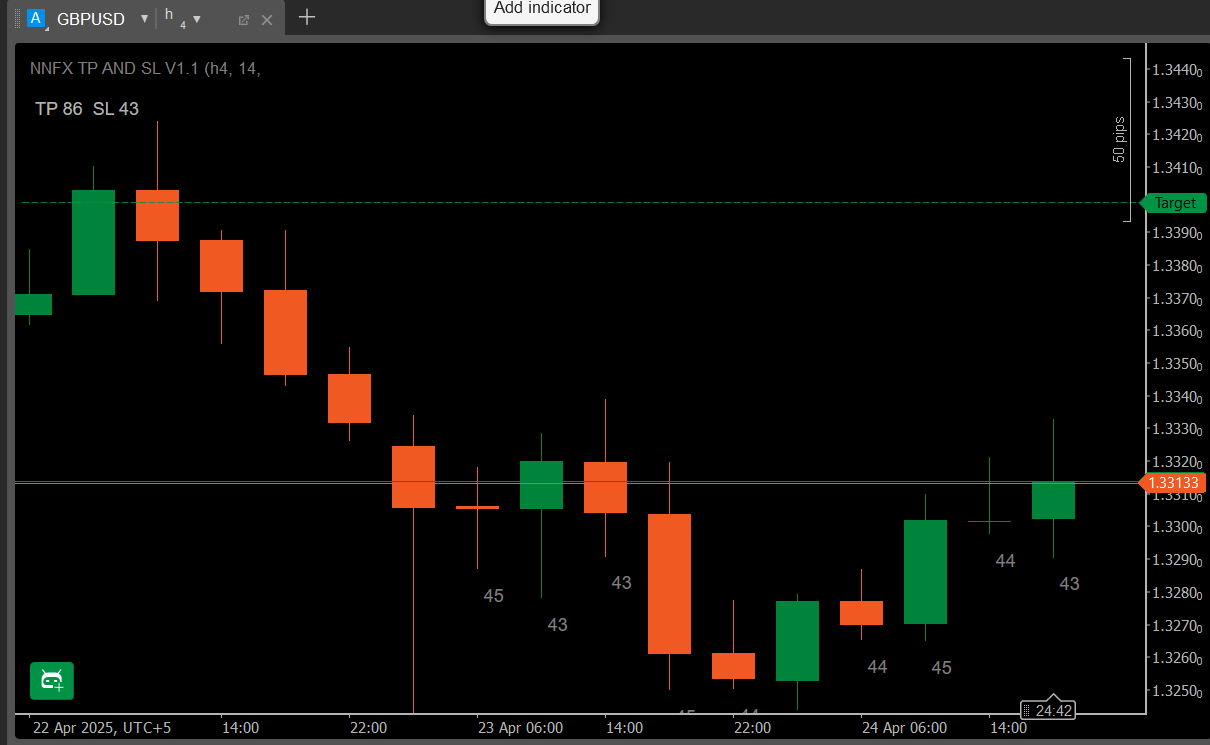
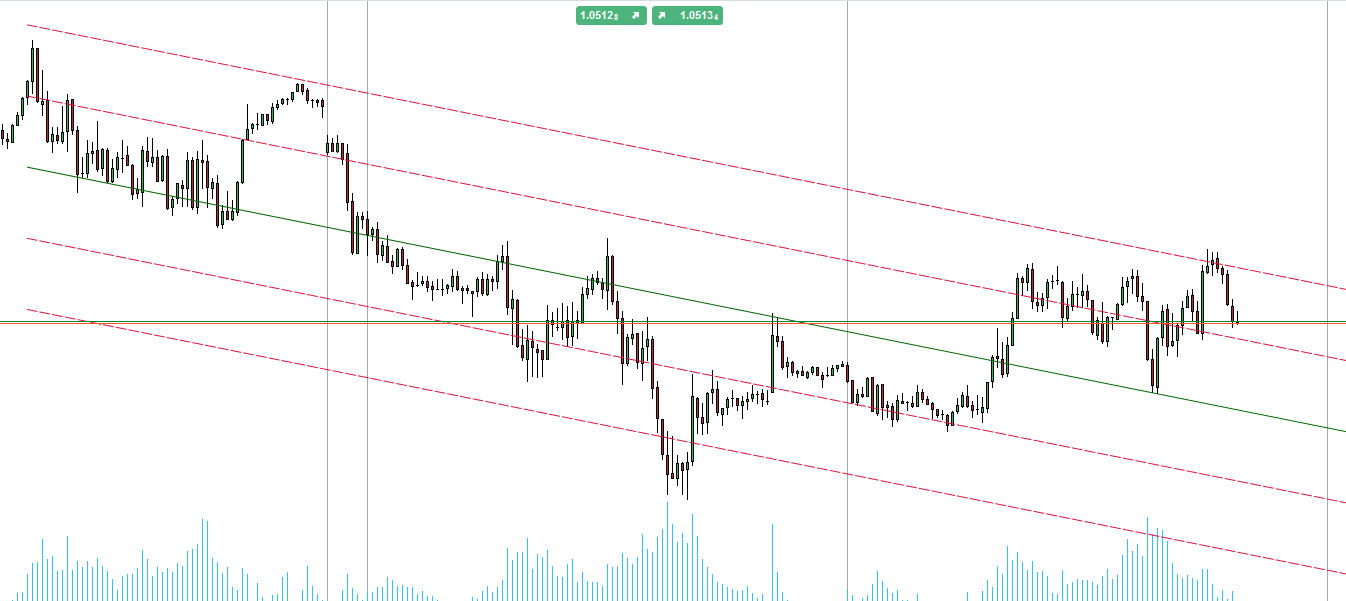
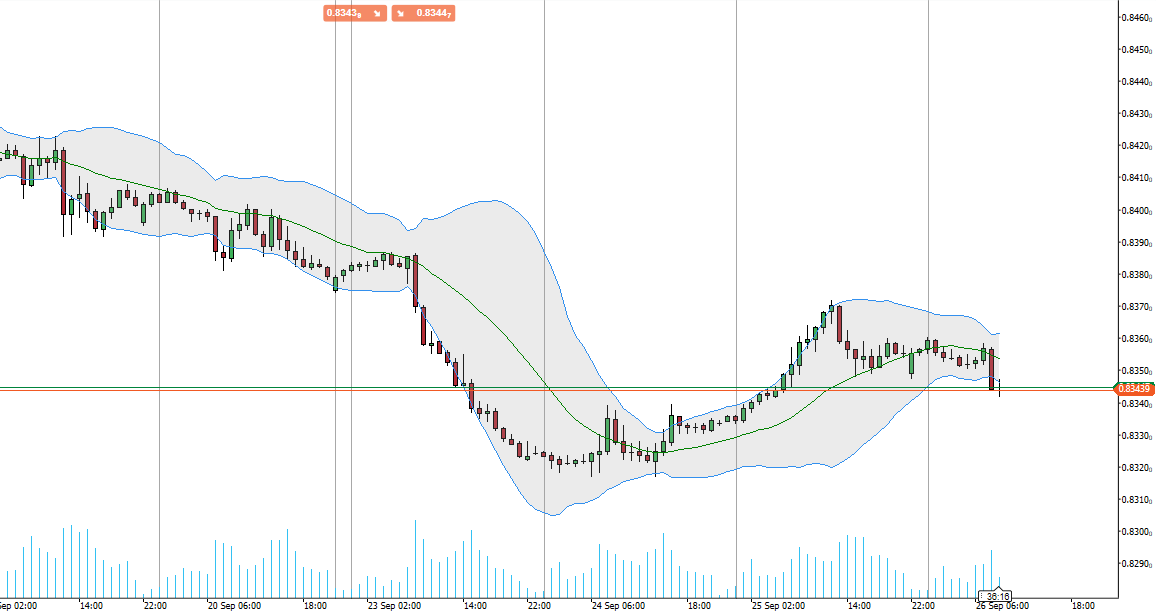
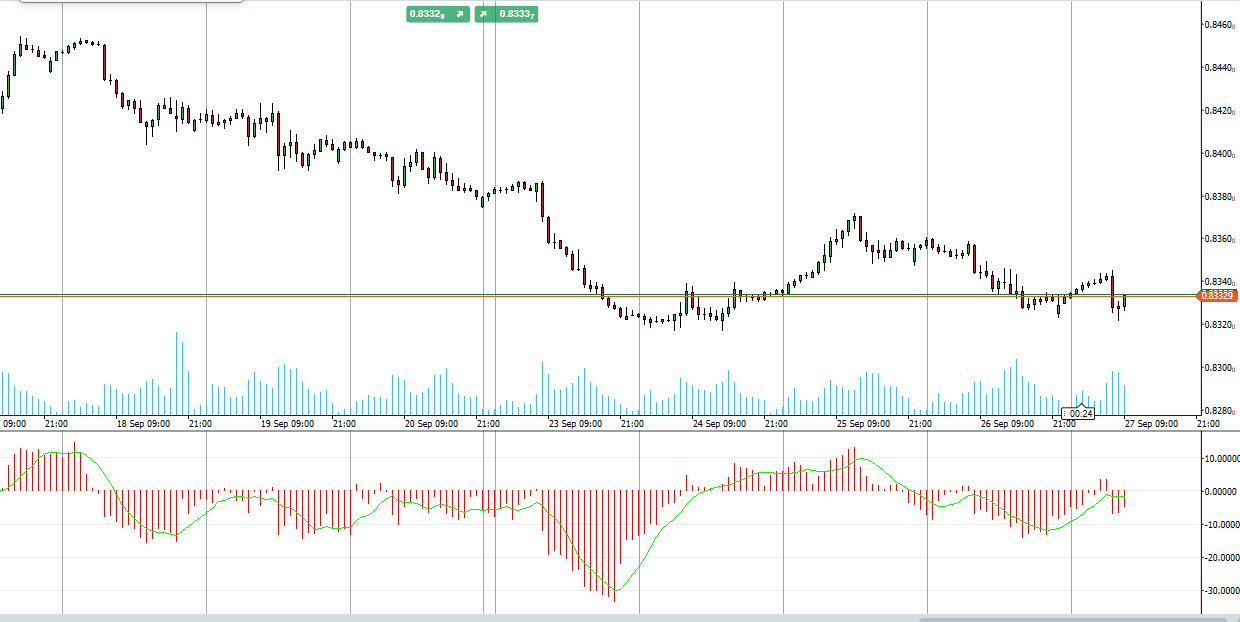
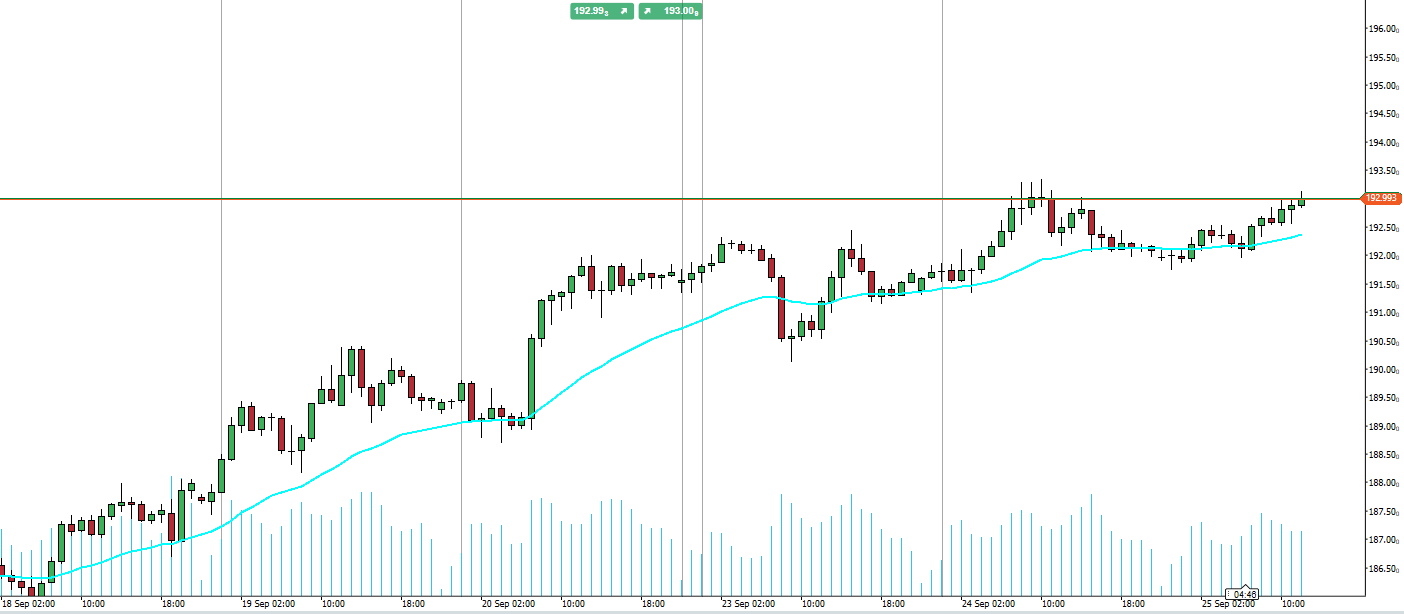
Introducing the VWAP indicator for cTrader, bringing the full functionality of TradingView's Volume Weighted Average Price to your trading platform.

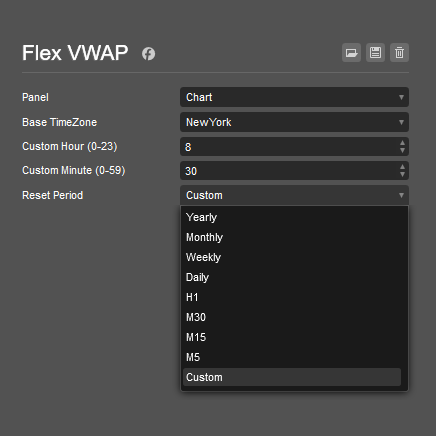
This comprehensive tool allows you to choose your anchor period (Session, Week, Month, Quarter, Year) and select from various price sources, including Open, High, Low, Close, HL2, HLC3, OHLC4, and HLCC4. Additionally, it can display up to three standard deviation upper and lower bands, providing a complete view of price distribution.

The VWAP indicator updates in real time with tick data, ensuring you have the most accurate and timely insights for your trading decisions. Elevate your trading strategy with the versatile and powerful VWAP indicator in cTrader.

More from this author
RT MACD
Customize the MACD! Choose colors, get real-time tick updates, and see crossover points for enhanced trading precision.
RT Chandelier Exit
Optimize exits with Chandelier Exit! Visualize stop-loss points dynamically for improved trading precision and safety.
Indicator
breakout
atr
RT ATR Bands
Enhance trading with ATR Bands! Visualize market volatility using dynamic upper and lower ATR bands for precise decision
Indicator
breakout
RT Standard Deviation Channel_noSourceCode
Visualize trends with Standard Deviation Channel! Display median, and add customizable upper/lower deviation channels.
RT TradingView ATR
Upgrade to ATR-RMA! Experience the precise ATR using Relative Moving Average for accurate volatility analysis in cTrader
Indicator
bollinger
RT Qualitative Quantity Estimation
Unlock trading precision with QQE! Dual QQE indicators with a Bollinger Bands zero line provide clear buy/sell signals.
Indicator
breakout
RT Consolidation Zones
Identify and trade breakouts with Consolidation Zones! Visualize price consolidation areas for trading opportunities.
Indicator
indices
RT True Strength Index
Enhance trading with TSI! Use the True Strength Index for clear insights into market momentum and trend strength.
RT Stochastic RSI PRO
Unlock Stochastic RSI PRO in cTrader! Overlay RSI, highlight zones, and identify divergences with customizable settings.
RT Moving Average PRO v1.1
Customize your Moving Average! Choose any timeframe and price source for precision and flexibility in your analysis.
RT MACD Histogram
Enhance MACD Histogram! Visualize bull and bear price changes with vibrant colors for clearer, more insightful trading.
RT Relative Moving Average
Bring the RMA to cTrader! This is the Relative Moving Average from TradingView.
Indicator
breakout
bollinger
RT Bollinger Bands Cloud
Visualize Bollinger Bands with a colored cloud for clarity. Enhance your trading precision with this dynamic indicator!
RT Time Segmented Volume
Enhance trading with TSV! Analyze volume flow and price trends using the powerful Time Segmented Volume indicator.
You may also like
Indicator
rsi
signal
MA-RSI HTF Confirmation
MA-RSI HTF Confirmation: Eliminate false signals and trade with confidence!
[Hamster-Coder] Pivot Points (Demo)
[Hamster-Coder] Pivot Points (Demo)
Indicator
signal
FAMA-MAMA
The FAMA-MAMA Indicator is a powerful, adaptive trend-following tool designed for professional and algorithmic traders.
Coloring Trendline with arrows
Coloring trendline/ Colored Trendline / Color Trendline
Indicator
breakout
ORB v1
Opening Range Breakout (ORB) - Visual Edition
Indicator
breakout
atr
signal
[Stellar Strategies] Market Structure Breakout
Flags breakouts of recent highs/lows on cTrader charts. Shows arrows/lines. Optional trend filter & sound alerts 📉📈
Indicator
breakout
supertrend
rsi
Swing Levels
🔍 Automatically detect support and resistance levels based on "swings" or pivots
Daily Sessions HighLow Helper
Shows daily and sessions highs / lows and session boxes, everything configurable
ICT Killzone and Sessions high_low
This indicator is an essential tool for traders seeking to visualize key trading sessions on their charts.
Indicator
forex
indices
gbpusd
+2
HorizontalSupportResistance
This extraordinary multi-timeframe support and resistance indicator is nothing short of market wizardry.
Indicator
xauusd
commodities
atr
+1
[Stellar Strategies] Visual Trend Momentum
Visual Trend Momentum is a MA/ATR/Volume trend tool. Visual signals for strong trends & reversals. Customizable. 📈📉
HTFOverlayPlus
HTFOverlayPlus
Institutional FVG Zones MTF with Confluence
Professional Fair Value Gaps with multitimeframe spot on
Indicator
forex
indices
eurusd
+3
Three Candle Patterns
Spot powerful 3-candle reversal patterns like Morning/Evening Star and Soldiers/Crows at key swing highs and lows
overbought oversold
Overbought Oversold Indicator
Stochastic RSI Indicator
Fibonacci Pitchfan
Powerful all-in-one tool for traders seeking a clear, dynamic view of market structure. By merging pivots, trendlines &
Candle Timer & Strength
Candle Timer & Strength for cTrader Description: Candle Timer & Strength is a powerful and intuitive indicator for cTrad