NNFX TP AND SL V1.1
Indicator
Version 1.0, Apr 2025
Windows, Mac
5.0
Reviews: 1

Description
🔹 What It Does
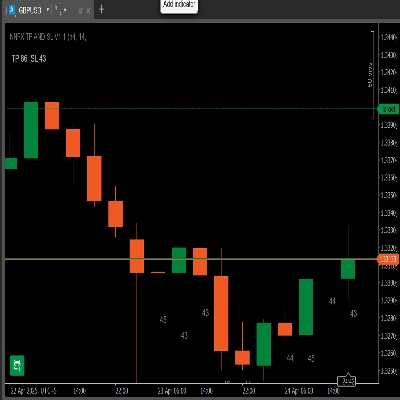
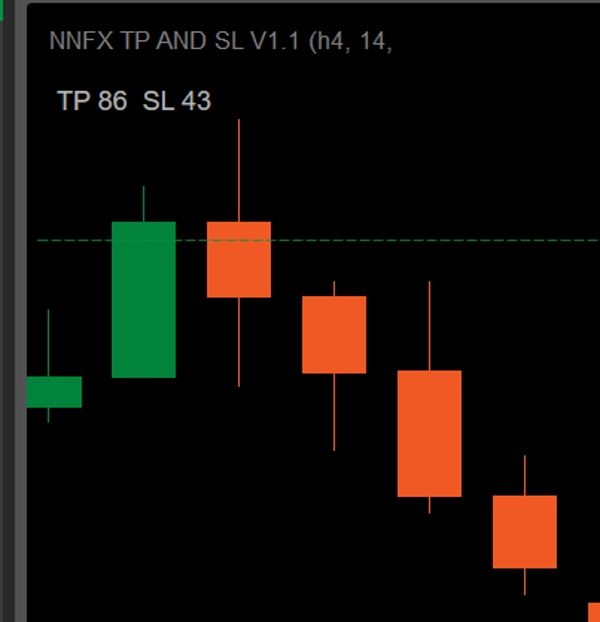
- Dynamic Panel: Shows “TP × SL” in pips based on your chosen ATR period and TP-multiplier.
- Last 10-Bar ATR Labels: Prints the ATR-in-pips under each of the last 10 candles (on the same timeframe).
- Timeframe Check: If you attach it on a different chart timeframe, it warns “Timeframes do not match – ATR not shown on bars.”
🔹 Key Features
- Panel Display
- TP = ATR × your Multiplier (choose 1 ÷ 4.5 in 0.5 steps)
- SL = ATR in pips
- Example: ATR = 43 → SL = 43 pips. If Multiplier = 2 → TP = 86 pips.
- Per-Bar ATR Labels
- Underlay the last 10 bars with their ATR values in pips.
- Keeps you instantly aware of recent volatility.
- Timeframe Validation
- Only draws labels when the chart’s timeframe matches your ATR Time-frame setting.
- Otherwise a red warning appears at the bottom.
- Spike Filtering (Optional)
- Enable a mean + k·σ filter to clamp flash-crash bars.
- Configurable σ-multiplier.
🔹 How to Install & Use
- Download
NNFXATRInfoIndicator_v1.1.algo. - In cTrader → Algo → Indicators, click Import Indicator and select the
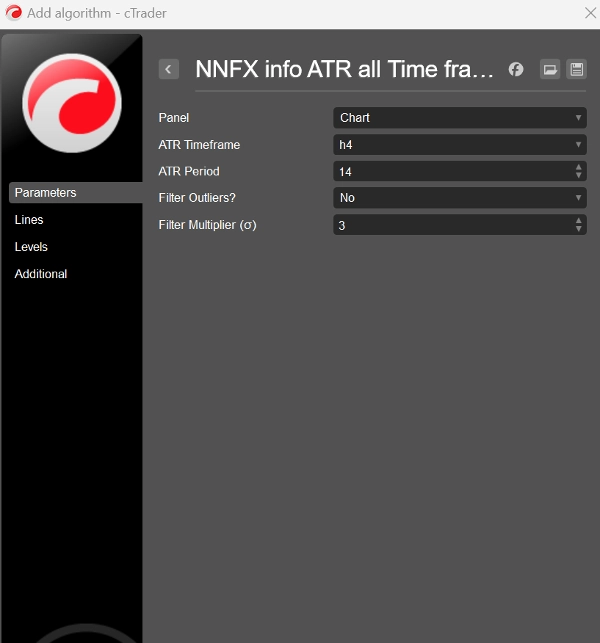
.algofile. - Add to Chart and open the Parameters tab:
- ATR Time-frame: e.g. H4
- ATR Period: default 14
- TP Multiplier: 1 – 4.5
- Use Spike Filter?: Yes/No
- Filter Multiplier σ: default 3
- Click Add to Chart. You’ll see the “TP × SL” panel top-left and the last-10-bar ATR labels appear automatically (if timeframes match).
🔹 Why You’ll Love It
- Zero Math: No more decimal-to-pip conversions—everything’s in whole pips.
- NNFX-Ready: SL & TP sized exactly to your system’s ATR rules. You only have to choose the timeframe and the trade direction you want to trade—then simply adjust the TP Multiplier to fit your preferred risk-reward ratio.
- Clear & Clean: All volatility info in one compact overlay—no extra panes.
- Ultra-Flexible: Any FX pair, any timeframe, fully customizable.
- supercharge your NNFX entries with precision ATR-based stops and targets!
Summary
Indicator profile
Customer reviews
5.0
Reviews: 1
5 | 100 % | |
4 | 0 % | |
3 | 0 % | |
2 | 0 % | |
1 | 0 % |
Customer reviews
May 3, 2025
the first test should keep DD under 3 percent, and the trade idea gets a pause before execution.
Discussion
FAQ
ATR
Products available through cTrader Store, including trading bots, indicators and plugins, are provided by third-party developers and made available for informational and technical access purposes only. cTrader Store is not a broker and does not provide investment advice, personal recommendations or any guarantee of future performance.


Price
Since 24/04/2025
27.69M
Traded volume
629.04K
Pips won