Indicator
Signal
[Stellar Strategies] Wave Trend Pro
!["[Stellar Strategies] Wave Trend Pro" logo](https://market-prod-23f4d22-e289.s3.amazonaws.com/8c93438a-6b0a-4026-93b2-0694329a3bc1_cT_cs_4141285_EURUSD_2025-04-25_17-52-31.png)
5.0
04/08/2025
176
Desktop
!["[Stellar Strategies] Wave Trend Pro" uploaded image](https://market-prod-23f4d22-e289.s3.amazonaws.com/a4a8f7a3-c39e-4ec9-89c8-9b83402d9941_cT_cs_4141285_EURUSD_2025-04-25_17-52-31.png)
!["[Stellar Strategies] Wave Trend Pro" uploaded image](https://market-prod-23f4d22-e289.s3.amazonaws.com/e450de36-fc3a-4630-83d9-1464d65f1269_cT_cs_4141285_EURUSD_2025-04-25_17-52-14.png)
!["[Stellar Strategies] Wave Trend Pro" uploaded image](https://market-prod-23f4d22-e289.s3.amazonaws.com/c07470bc-85c6-48d4-816a-4e6e77d48a29_cT_cs_4141285_XAUUSD_2025-04-25_18-00-32.png)
!["[Stellar Strategies] Wave Trend Pro" uploaded image](https://market-prod-23f4d22-e289.s3.amazonaws.com/d26a7bdb-0773-43f7-b94f-f2276f956f9d_cTrader_j61gNKTnOD.png)
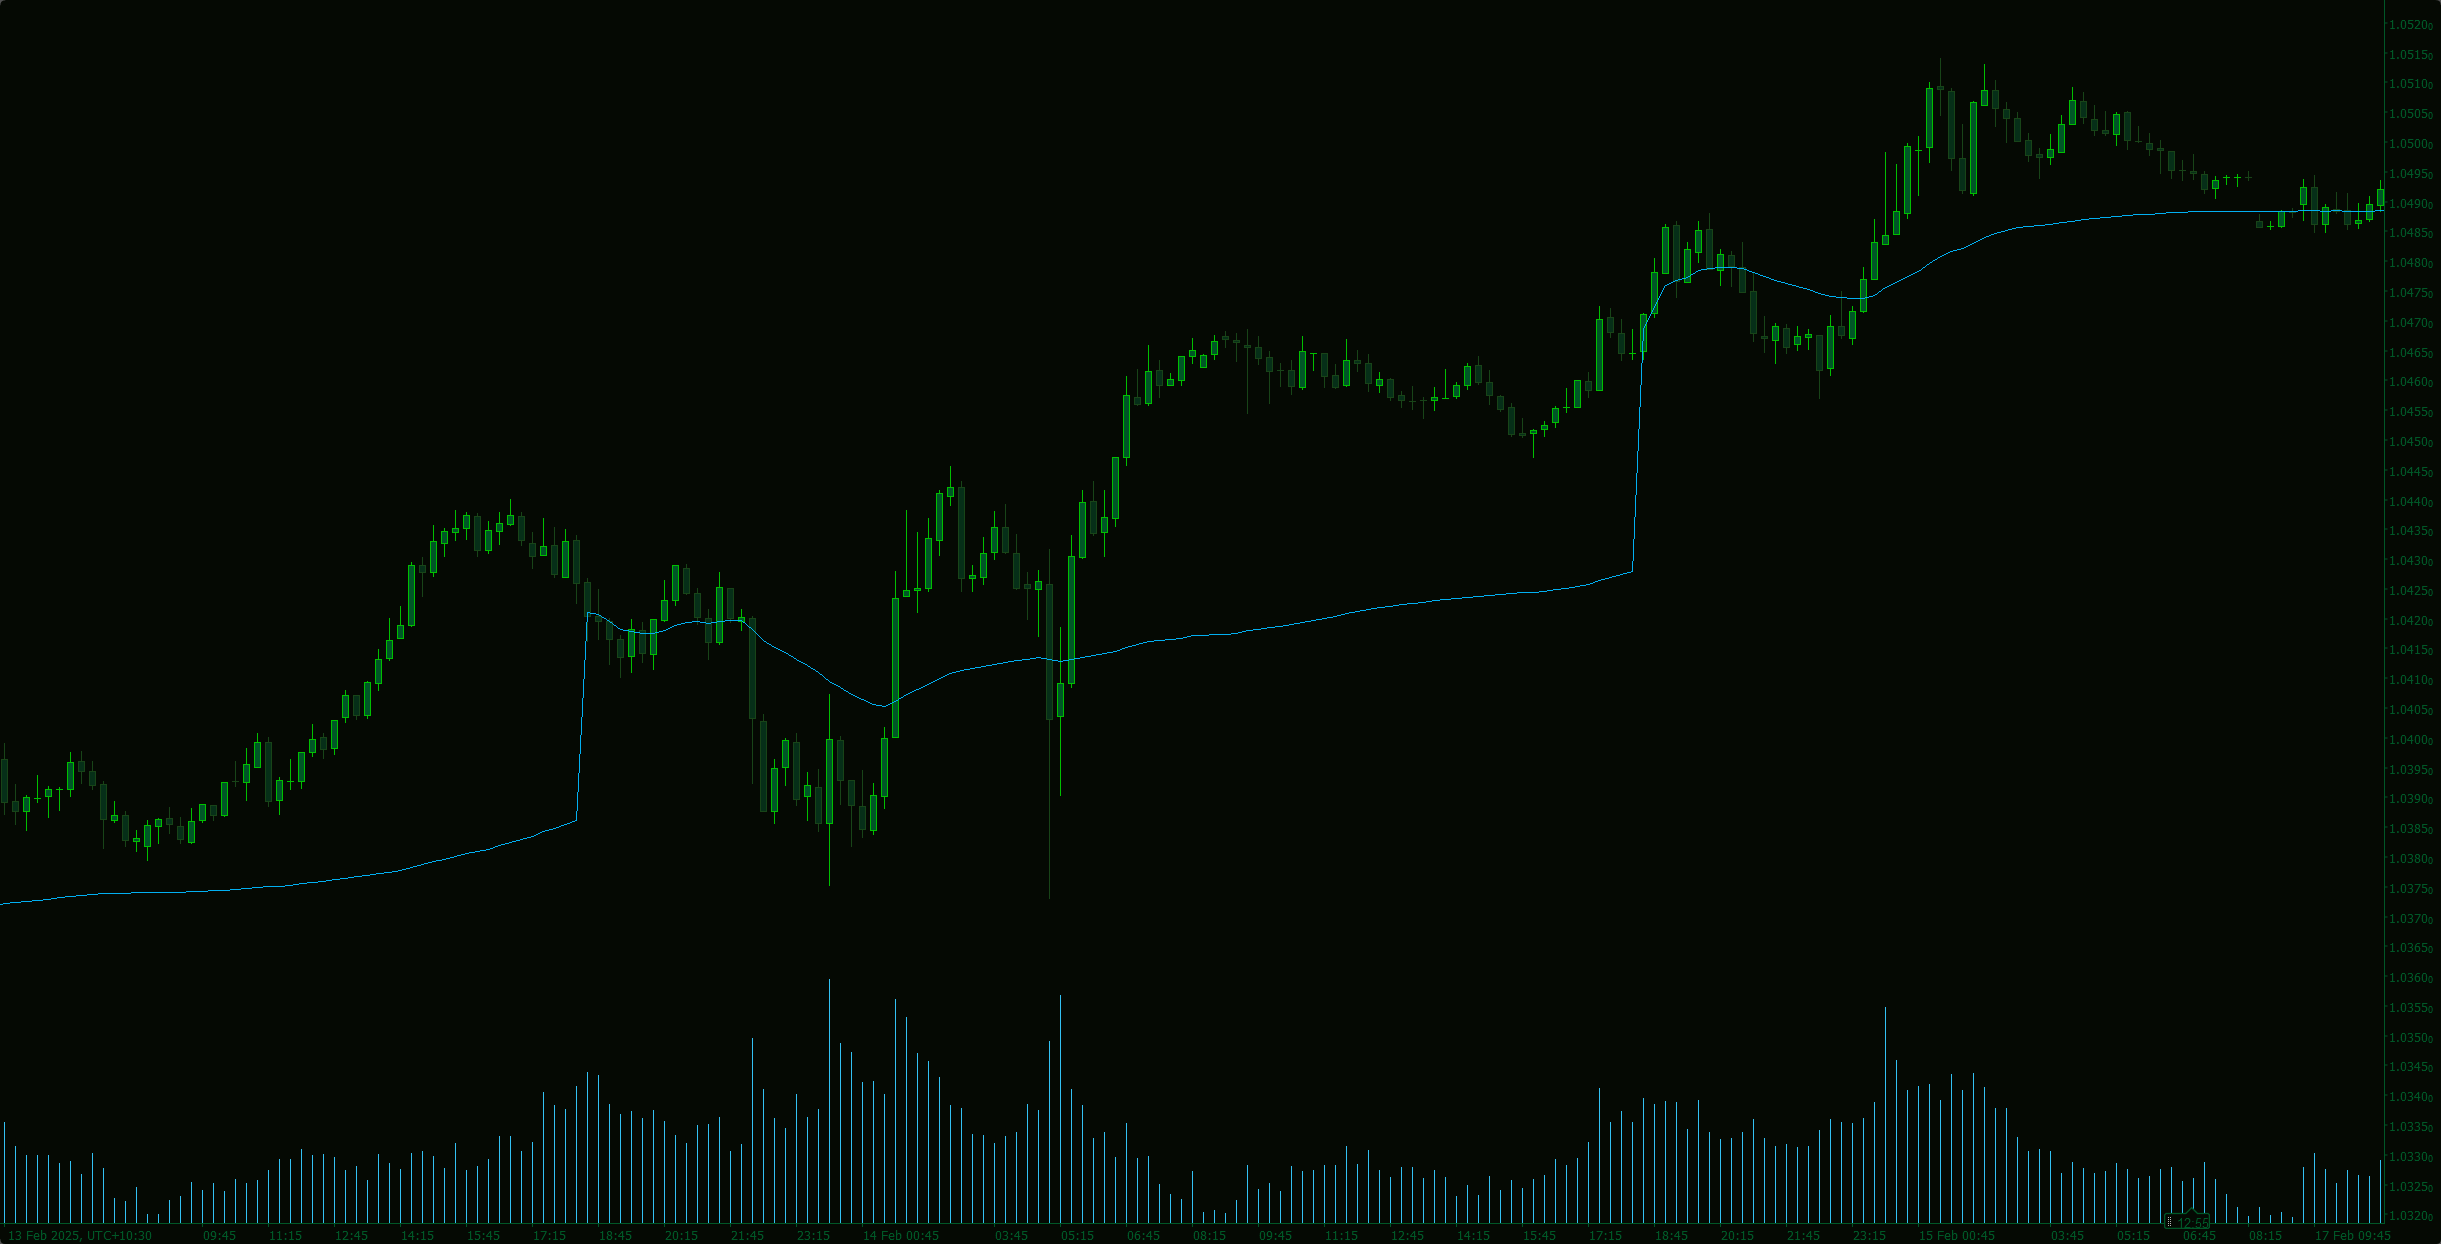
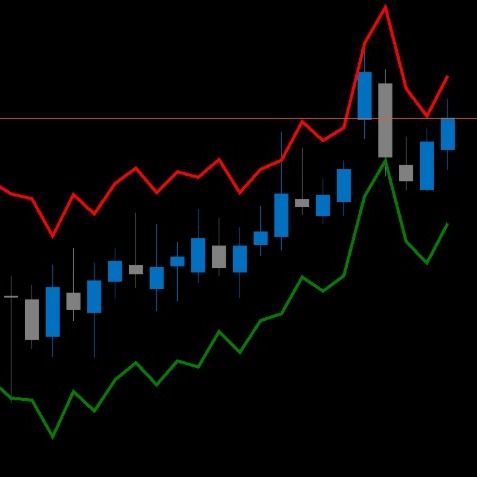
Wave Trend Pro Indicator for cTrader
Overview
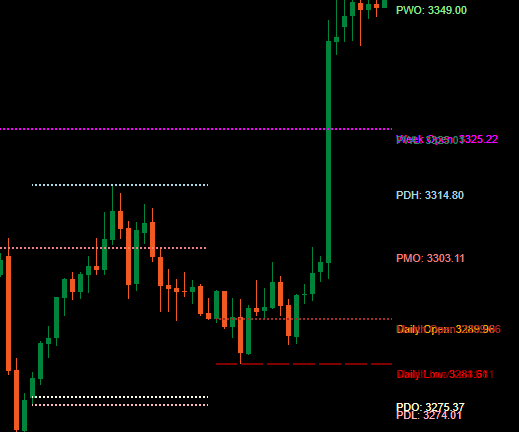
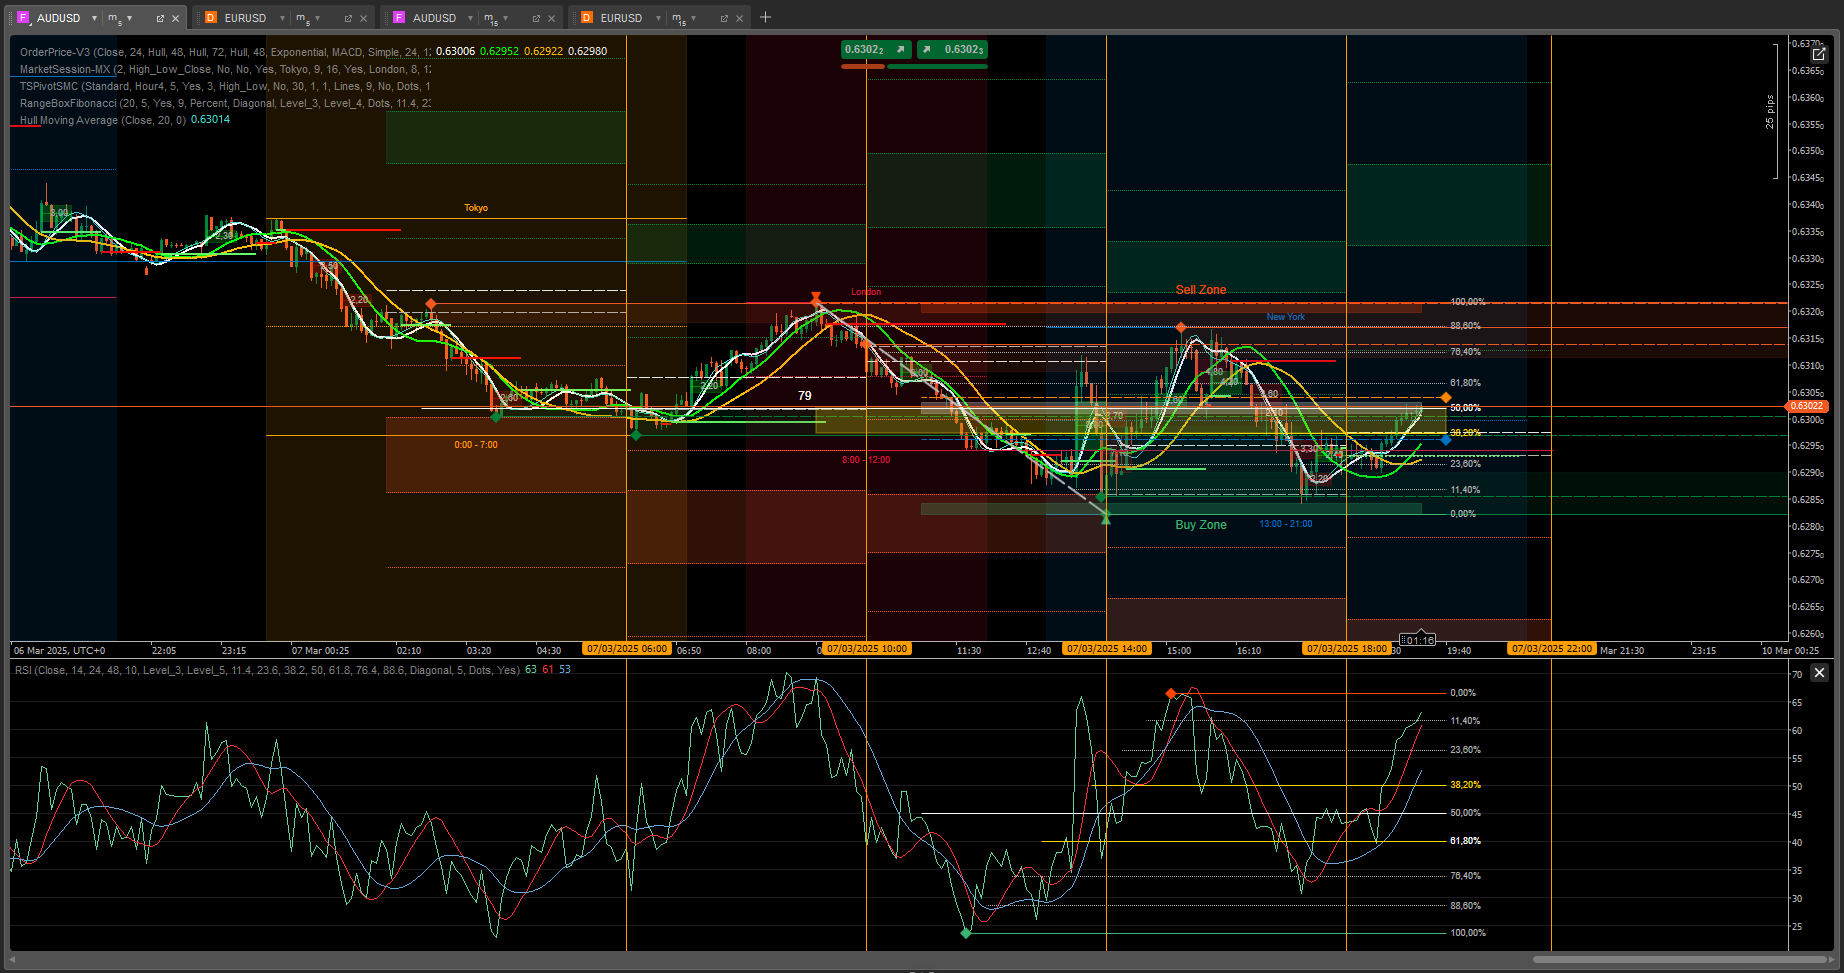
The Wave Trend Pro indicator is a momentum oscillator designed to help traders identify potential trend reversals and gauge market momentum. It utilizes two WaveTrend lines, a histogram representing their difference, and overbought/oversold levels to generate trading signals.
Components
More from this author
!["[Stellar Strategies] BOS Trend 1.0" logo](https://market-prod-23f4d22-e289.s3.amazonaws.com/808c7722-ba53-4633-b8a4-16f31eeb1fc2_[Stellar Strategies] BOS Trend.jpg)
!["[Stellar Strategies] MARSI Signal Plotter" logo](https://market-prod-23f4d22-e289.s3.amazonaws.com/ce01bd9f-8907-48d9-a68d-7c0bde6b9704_4aDZjo80P5.png)
!["[Stellar Strategies] Market Structure Breakout" logo](https://market-prod-23f4d22-e289.s3.amazonaws.com/99d762b3-fbbe-489d-9c19-e72c41ffe387_cT_cs_4141285_EURUSD_2025-04-21_20-25-12.png)
!["[Stellar Strategies] Market Session Ultimate" logo](https://market-prod-23f4d22-e289.s3.amazonaws.com/92b85b76-697c-4a8f-811f-ddd63eb8f9c8_cTrader_oSHtUgCtNJ.png)
!["[StellarStrategies] Scheduled Trade Executor" logo](https://market-prod-23f4d22-e289.s3.amazonaws.com/f13e96a0-274f-490e-8aa5-5a154d8bcf60_stellar12.jpg)
!["[Stellar Strategies] Inside Bar with Signals" logo](https://market-prod-23f4d22-e289.s3.amazonaws.com/c12d088e-7b52-4961-a0d2-7e38a2499bd3_cT_cs_4141285_EURUSD_2025-07-15_13-15-32.png)
!["[Stellar Strategies] Linear Regression Candles 1.1" logo](https://market-prod-23f4d22-e289.s3.amazonaws.com/19ef277f-e0b6-48ef-8941-88bfbba145f3_cT_cs_4141285_EURUSD_2025-03-30_19-53-31.png)
!["[Stellar Strategies] Visual Trend Momentum" logo](https://market-prod-23f4d22-e289.s3.amazonaws.com/3835d044-1c21-4909-9d3c-2635f984b93d_visualtrendmomentum.jpg)
!["[Stellar Strategies] QQE" logo](https://market-prod-23f4d22-e289.s3.amazonaws.com/ed4b3af5-54e4-404e-80eb-a23fa7ef0282_cTrader_7oDDAbSmSP.png)
!["[Stellar Strategies] Moving Averages Combined 1.0" logo](https://market-prod-23f4d22-e289.s3.amazonaws.com/b4cd360c-5f3c-4902-b2e1-6b86da1199bb_Gemini_Generated_Image_nl1erpnl1erpnl1e.jpg)
!["[Stellar Strategies] SP500 Gap Closure cBot 1.0" logo](https://market-prod-23f4d22-e289.s3.amazonaws.com/62a77232-02a9-423b-a5e4-bd2c2bc8db97_cT_cs_4141285_US500_2025-03-21_17-12-57.png)
!["[Stellar Strategies] Ultimate Trend & Momentum Dashboard" logo](https://market-prod-23f4d22-e289.s3.amazonaws.com/d8a894f3-34df-4f37-b4a3-c37e971e4e1f_cT_cs_4141285_NAS100_2025-06-24_17-12-20.png)
!["[Stellar Strategies] Market Regime Filter" logo](https://market-prod-23f4d22-e289.s3.amazonaws.com/cb84a98c-46f6-4cfd-b0ba-16518a618cb1_cT_cs_4141285_EURUSD_2025-04-20_16-50-30.png)
You may also like

.jpg)
.jpg)

.png)