
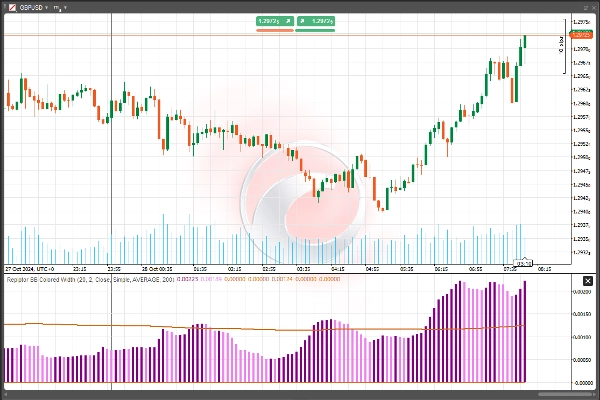
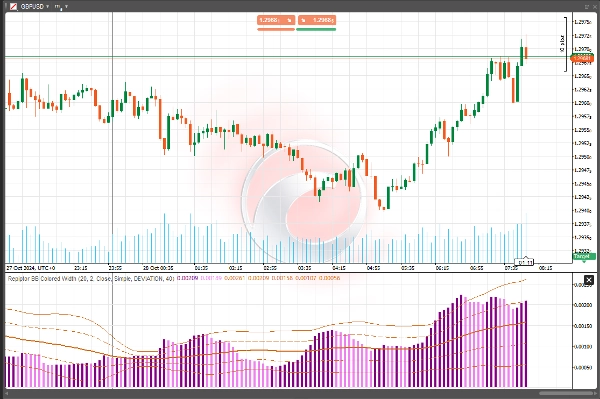
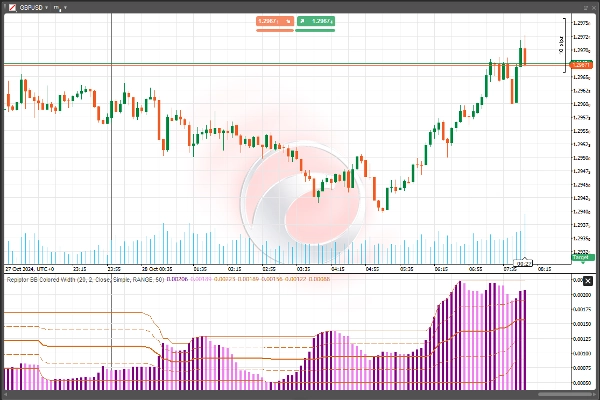
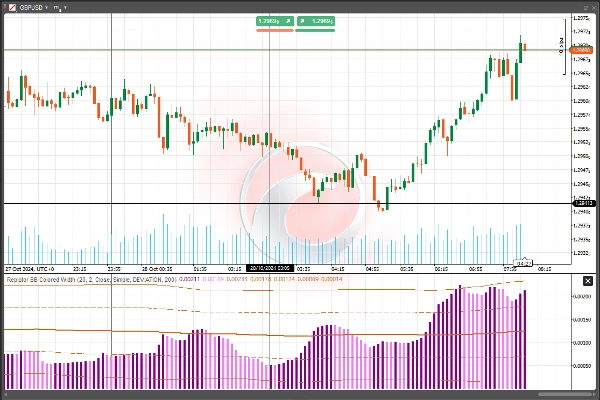
Repiptor BB Colored Width
Indicador
156 descargas
Versión 1.0, Oct 2024
Windows, Mac
5.0
Valoraciones: 1
Descripción
Anchura de las Bandas de Bollinger coloreadas con cuatro niveles dinámicos alternativos:
- Promedio
- Mediana
- Desviación
- Rango
Color más oscuro = volatilidad al alza, Color más claro = volatilidad a la baja
Resumen
Resumen de IA
Repiptor BB Colored Width is a technical indicator that visualizes the width of Bollinger Bands with color coding to represent volatility changes. It offers four dynamic measurement levels for the Bollinger Bands width: Average, Median, Deviation, and Range. The indicator uses color intensity to indicate volatility trends—darker colors signify increasing volatility, while lighter colors indicate decreasing volatility. This tool helps traders assess market volatility visually by highlighting changes in the Bollinger Bands width on their charts.
Perfil del indicador
Valoraciones de clientes
5.0
Valoraciones: 1
5 | 100 % | |
4 | 0 % | |
3 | 0 % | |
2 | 0 % | |
1 | 0 % |
Valoraciones de clientes
August 18, 2025
Clear volatility visualization, customizable, lightweight. Cons: No alerts, no MTF mode, lacks integrated breakout signals.
Conversación
Preguntas frecuentes
Bollinger
Los productos disponibles a través de cTrader Store, incluidos bots, indicadores y plugins para operar, son proporcionados por desarrolladores de terceros y están disponibles únicamente con fines informativos y de acceso técnico. cTrader Store no es un bróker, por lo que no proporciona asesoramiento de inversión, recomendaciones personales ni ninguna garantía de rentabilidad futura.
Más de este autor


![Logotipo de "[CB] Pivot Points Pro"](https://cdn.ctrader.com/image/webp/43463c82-67b0-4f10-a4ba-901bba091d81_32594)


Precio
Desde 26/10/2024
1.19K
Instalaciones gratis