Descripción
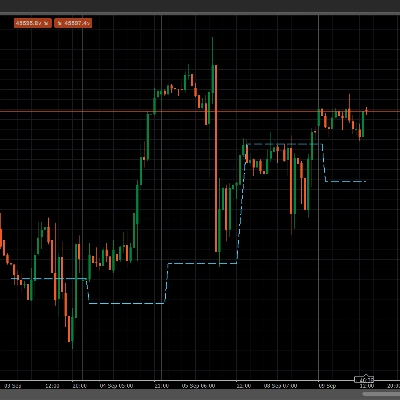
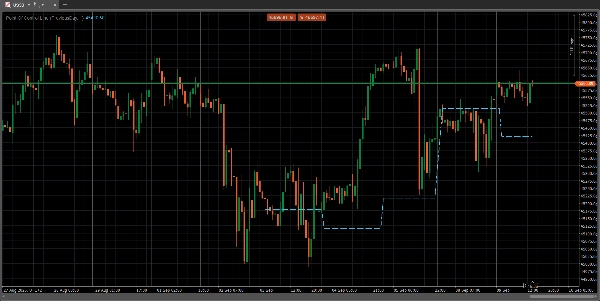
El Punto de Control es un nivel de precio en un gráfico de perfil de volumen donde se ha realizado el mayor volumen de operaciones dentro de un período especificado. Este nivel actúa como una zona significativa de soporte o resistencia porque representa un precio donde las grandes instituciones comerciales estuvieron más activas y donde el precio del mercado encontró consenso. Los traders usan la línea para identificar zonas clave de precio, medir el sentimiento del mercado y anticipar posibles movimientos y reversiones de precio
Resumen
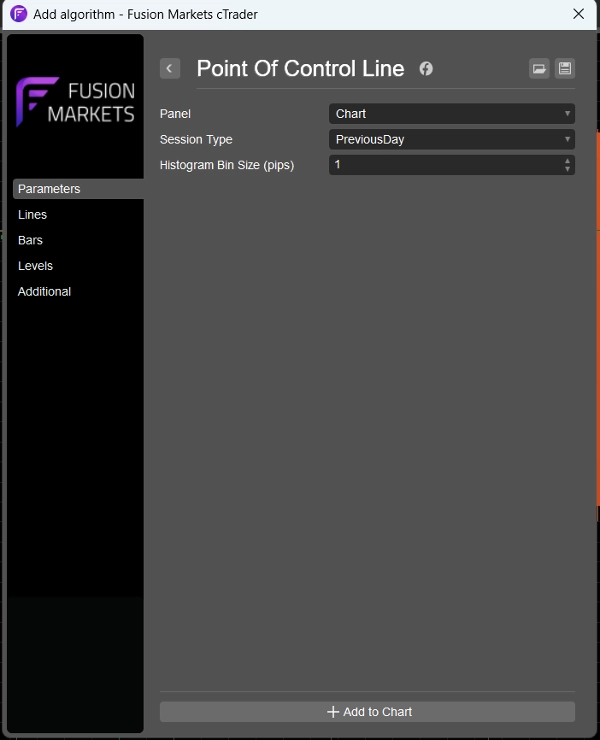
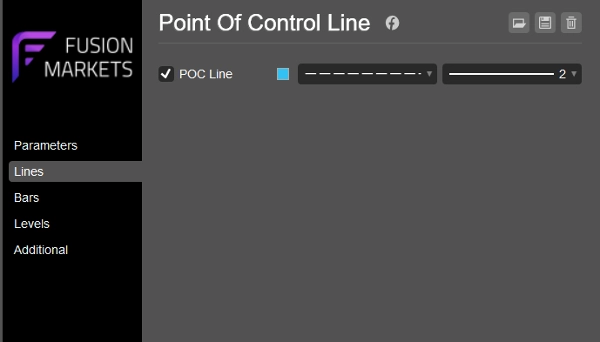
Perfil del indicador
Valoraciones de clientes
0.0
Valoraciones: 0
Valoraciones de clientes
Este producto todavía no se ha valorado. ¿Ya lo ha probado? Sea el primero en informar a otros.
Conversación
Preguntas frecuentes
Forex
Indices
Los productos disponibles a través de cTrader Store, incluidos bots, indicadores y plugins para operar, son proporcionados por desarrolladores de terceros y están disponibles únicamente con fines informativos y de acceso técnico. cTrader Store no es un bróker, por lo que no proporciona asesoramiento de inversión, recomendaciones personales ni ninguna garantía de rentabilidad futura.
Más de este autor


Precio
Desde 21/04/2025