
Deskripsi
Indikator mengikuti tren yang adaptif terhadap volatilitas yang secara dinamis menyesuaikan dengan kondisi pasar.
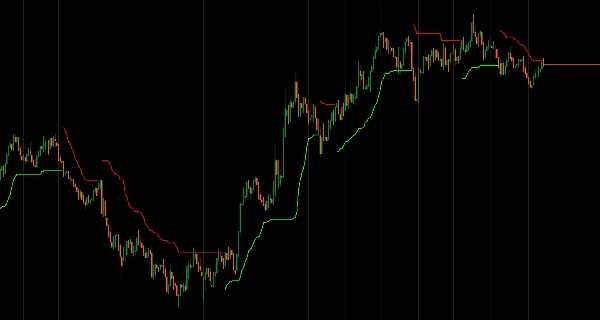
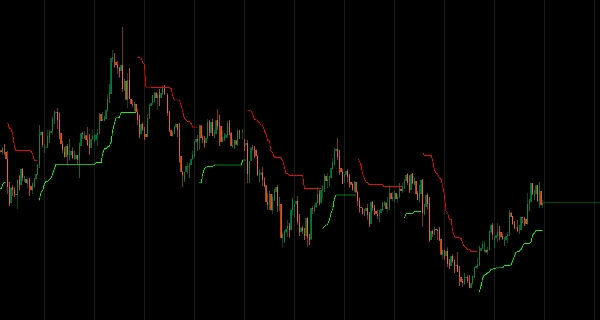
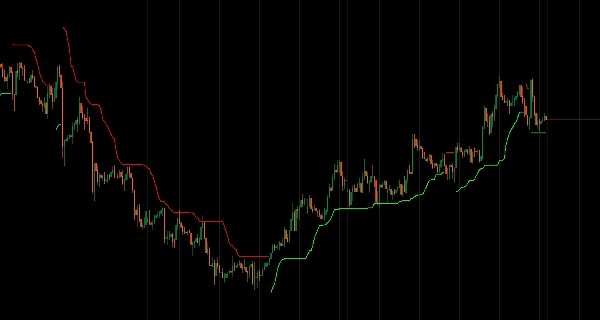
Indikator ini menciptakan trailing stop cerdas yang secara otomatis mengencang di pasar yang tenang dan melebar selama periode volatil. Berbeda dengan trailing stop statis, indikator ini menyesuaikan jaraknya berdasarkan volatilitas waktu nyata, kekuatan tren, dan rezim pasar.
Fitur Utama:
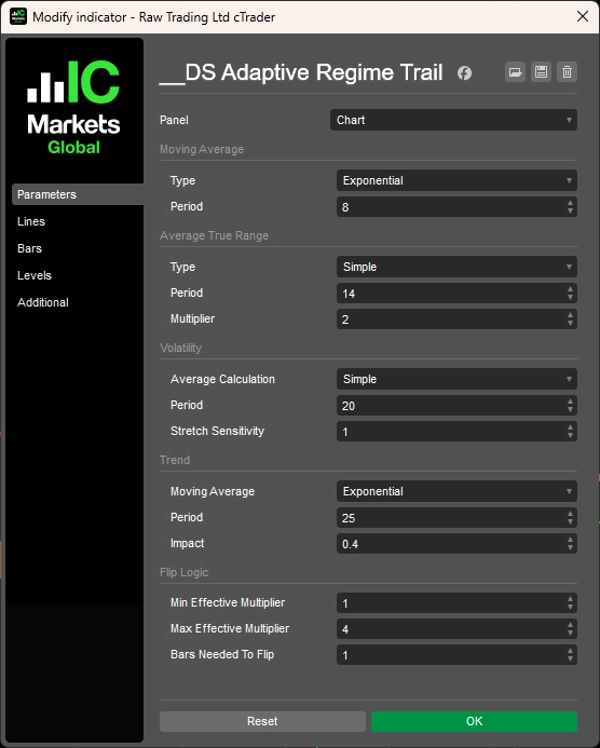
- Adaptasi Volatilitas Cerdas: Secara otomatis menyesuaikan lebar trailing menggunakan pengukuran volatilitas berbasis ATR
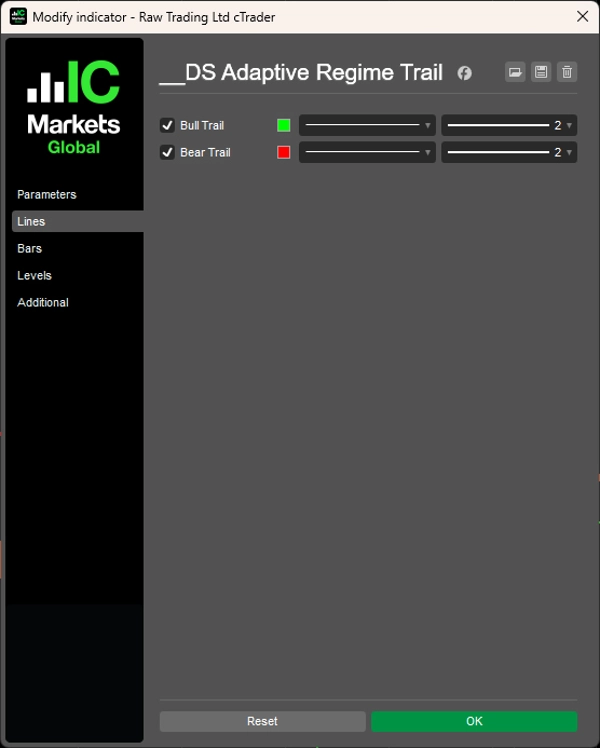
- Deteksi Rezim: Mengidentifikasi tren bull/bear dengan logika konfirmasi untuk menyaring sinyal palsu
- Memori Tren: Menggabungkan momentum arah untuk memperlebar trailing selama tren kuat
- Tampilan Visual Bersih: Menampilkan hanya trailing aktif (bull atau bear), menjaga grafik tetap rapi
- Sangat Dapat Disesuaikan: Kontrol penuh atas jenis MA, sensitivitas, dan persyaratan konfirmasi
Cara Kerja:
Indikator menggabungkan tiga komponen adaptif:
- Volatility Stretch - Memperlebar trailing saat volatilitas saat ini melebihi rata-rata
- Trend Boost - Menambahkan ruang bernapas selama pergerakan arah yang kuat
- Konfirmasi Rezim - Memerlukan bar tertentu untuk mengonfirmasi pembalikan tren, mengurangi whipsaw
Sangat cocok untuk trader yang menginginkan level support/resistance dinamis yang menghormati struktur pasar daripada jarak sewenang-wenang.
Konsep dan metodologi asli diadaptasi dari "Trend Following Volatility Trail" TradingView oleh HDAlgos.
Ringkasan
Profil indikator
Ulasan pelanggan
0.0
Ulasan: 0
Ulasan pelanggan
Belum ada ulasan untuk produk ini. Sudah mencobanya? Jadilah pemberi ulasan pertama!
Diskusi
Pertanyaan umum
Breakout
Produk-produk yang tersedia melalui cTrader Store, termasuk bot trading, indikator, dan plugin, disediakan oleh pengembang pihak ketiga serta hanya ditujukan untuk akses teknis dan informasi. cTrader Store bukan broker dan tidak menyediakan saran investasi, rekomendasi pribadi, atau jaminan apa pun tentang kinerja di masa mendatang.
Produk lain dari penulis ini


Harga
Sejak 20/12/2024
8.31K
Instal gratis