
Descripción
📌 Tendencia del Filtro de Kalman – Resumen y Revisión
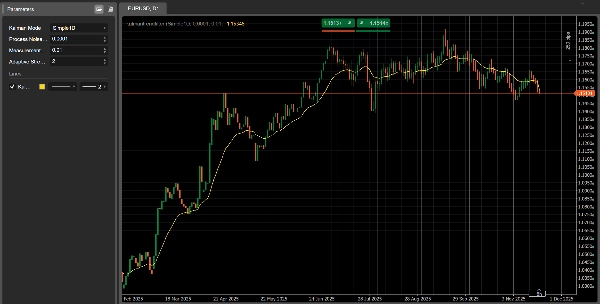
Tendencia del Filtro de Kalman es un indicador avanzado de seguimiento de tendencias para cTrader, diseñado para ofrecer una línea de tendencia suave y altamente sensible con un retraso significativamente menor que los promedios móviles tradicionales.
Donde los filtros clásicos SMA/EMA reaccionan lentamente y a menudo pierden los cambios tempranos de tendencia, el Filtro de Kalman:
- Actualiza continuamente su estimación del “precio verdadero”
- Equilibra matemáticamente la suavidad y la capacidad de respuesta
- Se adapta a la volatilidad (modo Adaptativo)
- Modela tanto precio como velocidad (modo 2D)
Esto lo convierte en una herramienta poderosa tanto para traders manuales como para desarrolladores de sistemas automatizados.
🎛 Modos y Parámetros
Modo Kalman (3 Versiones en un Indicador)
1️⃣ Simple1D
Un filtro Kalman clásico 1D.
Rápido, limpio y excelente para la detección de tendencias a corto plazo.
2️⃣ PositionVelocity2D
Modela tanto el precio como la velocidad de la tendencia.
Ideal como filtro direccional en estrategias algorítmicas.
3️⃣ Adaptive1D
Se ajusta automáticamente a la volatilidad.
Más reactivo en mercados rápidos, más suave en condiciones tranquilas.
🧩 Parámetros Clave Explicados
- Ruido del Proceso (Q):
Mayor = reacción más rápida a la tendencia, menor = línea más suave. - Ruido de Medición (R):
Mayor = el filtro confía menos en los datos → resultado más suave. - Fuerza Adaptativa:
Usado solo en Adaptive1D. Controla qué tan fuertemente la volatilidad afecta al filtro.
📈 Cómo Interpretar las Señales
1. Detectar la Dirección de la Tendencia
- Tendencia Alcista: Línea inclinada hacia arriba, precio manteniéndose por encima del filtro.
- Tendencia Bajista: Línea inclinada hacia abajo, precio manteniéndose por debajo del filtro.
- Lateral: El mercado está en rango, evitar estrategias de ruptura.
2. Señales de Entrada (Lógica de Cruce)
Entrada Alcista:
- El precio cierra por encima de la línea de Kalman
- La línea comienza a girar hacia arriba
Entrada Bajista:
- El precio cierra por debajo de la línea de Kalman
- La línea comienza a girar hacia abajo
3. Fuerza de la Tendencia (Modo 2D)
La pendiente se convierte en una lectura directa del momentum:
- Pendiente fuerte hacia arriba → tendencia alcista fuerte
- Pendiente fuerte hacia abajo → tendencia bajista fuerte
- Pendiente aplanándose → debilitamiento de la tendencia o fase de transición
📊 Ejemplos Prácticos de Uso
✔ Estrategia de Seguimiento de Tendencia
Usa Simple1D o Adaptive1D:
- Compra por encima de la línea cuando la pendiente se vuelve positiva
- Vende por debajo de la línea cuando la pendiente se vuelve negativa
✔ Enfoque Multi-Timeframe
- Usa Kalman en H1 para la dirección
- Usa Kalman en M15 para entradas precisas
- Entra solo en la dirección indicada por el timeframe superior
✔ Integración con Bots
Perfecto para trading algorítmico:
- Permitir solo largos si la pendiente > 0
- Permitir solo cortos si la pendiente < 0
- Usar Adaptive1D para índices volátiles como US500, NAS100, US2000
🌟 Únete a Nuestra Comunidad
Si deseas acceso a:
- Optimizaciones exclusivas para cada uno de nuestros bots
- Consejos avanzados de configuración
- Mejoras en el trading
- Ayuda técnica personalizada
- Actualizaciones y nuevas herramientas
👉 Únete a nuestra comunidad haciendo clic en el enlace en mi página de perfil.
Allí encontrarás las mejores configuraciones de optimización para todos nuestros bots, actualizadas regularmente.
Resumen
Valoraciones de clientes
5 | 0 % | |
4 | 100 % | |
3 | 0 % | |
2 | 0 % | |
1 | 0 % |


