الوصف
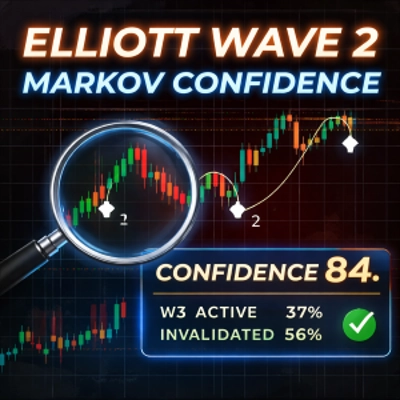
إليوت كلين — Wave2 + ماركوف كونفيدنس
إليوت كلين هو مؤشر تحليلي متقدم مصمم لمساعدة المتداولين على تحديد والتحقق وإدارة إعدادات موجة إليوت 2 باستخدام مزيج من هيكل السوق و الاحتمالية الإحصائية.
بدلاً من التنبؤ باتجاه السعر، يركز المؤشر على التحولات الهيكلية ويجيب على سؤال أكثر فائدة:
ما مدى احتمال تطور موجة 2 إلى موجة 3 صالحة ومستدامة — وكم يجب أن يثق المتداول في هذا السيناريو؟
ما الذي يفعله هذا المؤشر
يقوم إليوت كلين تلقائيًا بـ:
- كشف هياكل موجة 1–موجة 2 بناءً على نقاط التحول
- تحديد المحفز، وقف الخسارة، الإبطال، وأهداف موجة 3
- تتبع النتائج الهيكلية التاريخية باستخدام نموذج ماركوف ذو 5 حالات
- حساب الاحتمالات الشرطية لـ:
-
- تنشيط موجة 3
- إبطال الإعداد
- نفاد مبكر لموجة 3
- تحويل هذه الاحتمالات إلى درجة ثقة واحدة (0–100)
هذا يسمح للمتداولين بتصفية الإعدادات منخفضة الجودة، وتجنب الإفراط في التداول، والضغط على الصفقات فقط عندما يتوافق الهيكل والإحصائيات.
الميزات الأساسية
- ✅ الكشف التلقائي عن موجة إليوت 2
- ✅ أوضاع تأكيد متعددة (كسر+ثبات، كسر، استعادة، فتيل)
- ✅ محفز واضح، وقف خسارة، إبطال، وأهداف متوقعة
- ✅ محرك احتمالات ماركوف ذو 5 حالات (مبني على الأحداث/التقلبات، وليس على الأعمدة)
- ✅ احتمالات شرطية في الوقت الحقيقي معروضة على الرسم البياني
- ✅ درجة ثقة واحدة (0–100) لدعم القرار
- ✅ تصميم HUD نظيف وغير متطفل
- ✅ يعمل على أي رمز وأي إطار زمني
درجة الثقة (مهمة)
درجة الثقة ليست معدل نجاح و ليست إشارة.
إنها مقياس جودة سياقي مشتق من التحولات الهيكلية التاريخية:
- أثناء موجة 2، تعكس الدرجة:
-
- احتمالية بدء موجة 3
- معدلة باحتمالية الفشل المبكر
- أثناء موجة 3، تعكس الدرجة:
-
- احتمالية تاريخية لاستمرار موجة 3 دون نفاد مبكر
في الممارسة العملية:
- درجات منخفضة = الهيكل ضعيف أو غير موثوق
- درجات عالية = الهيكل نادر لكنه قوي إحصائيًا
هذا يساعد المتداولين على اتخاذ قرار متى يكون الحذر ومتى يسمح للصفقة بالعمل.
حالات الاستخدام النموذجية
- ✔ تصفية إعدادات موجة إليوت قبل الدخول
- ✔ تجنب صفقات موجة 2 الهامشية أو منخفضة الجودة
- ✔ تعديل حجم المركز بناءً على الثقة
- ✔ إدارة صفقات موجة 3 مع تقليل التدخل العاطفي
- ✔ دعم التداول التقديري ببيانات هيكلية موضوعية
المؤشر مفيد بشكل خاص للمتداولين الذين يفهمون بالفعل نظرية موجة إليوت ويريدون تأكيدًا كميًا بدون أتمتة.
كيفية الاستخدام (سير العمل الأساسي)
- اربط المؤشر بالرسم البياني
- اختر وضع التأكيد المفضل لديك
- انتظر هيكل موجة 2 صالح
- راقب:
-
- المحفز، وقف الخسارة، الإبطال
- احتمالات ماركوف
- درجة الثقة
- قرر ما إذا كان الإعداد يستحق التداول بناءً على الهيكل + الثقة
ملاحظات مهمة وإخلاء مسؤولية
- هذا المؤشر تحليلي، وليس تنبؤي
- لا ينتج إشارات شراء/بيع
- الإحصائيات الهيكلية السابقة لا تضمن النتائج المستقبلية
- التداول ينطوي على مخاطر؛ المستخدمون مسؤولون بالكامل عن قراراتهم
المؤشر مخصص كـ أداة دعم القرار للمتداولين التقديريين.
لمن هذا المؤشر
- المتداولون المألوفون بمفاهيم موجة إليوت
- المتداولون التقديريون الذين يقدرون الهيكل على المؤشرات
- المتداولون الباحثون عن مرشحات موضوعية، وليس أنظمة مؤتمتة
- المستخدمون الذين يريدون سياق الاحتمالية، وليس تسميات بأثر رجعي
_______________________
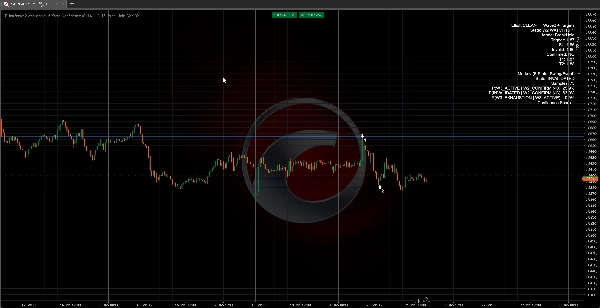
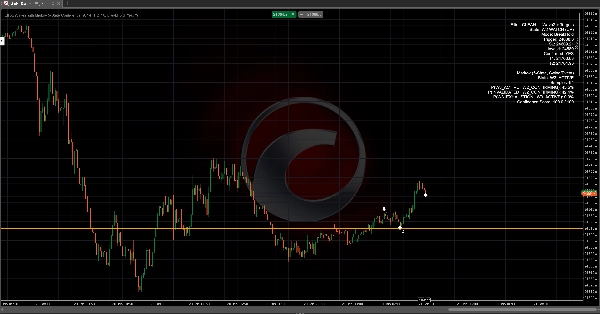
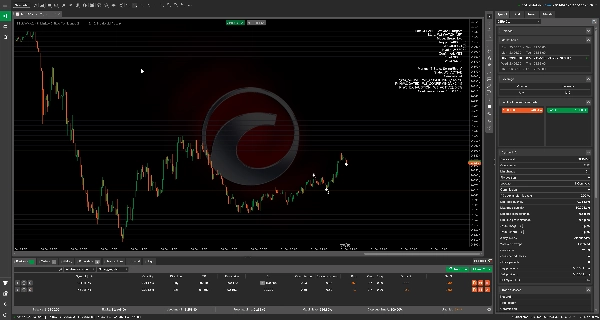
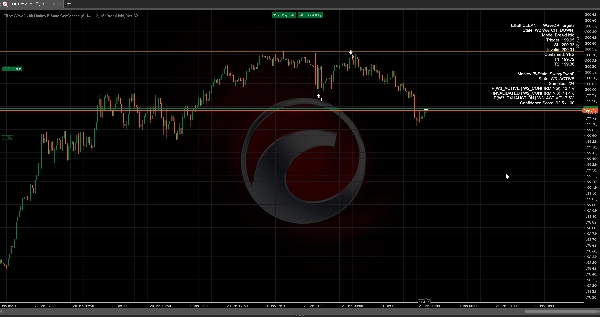
واجهة المستخدم والحالات
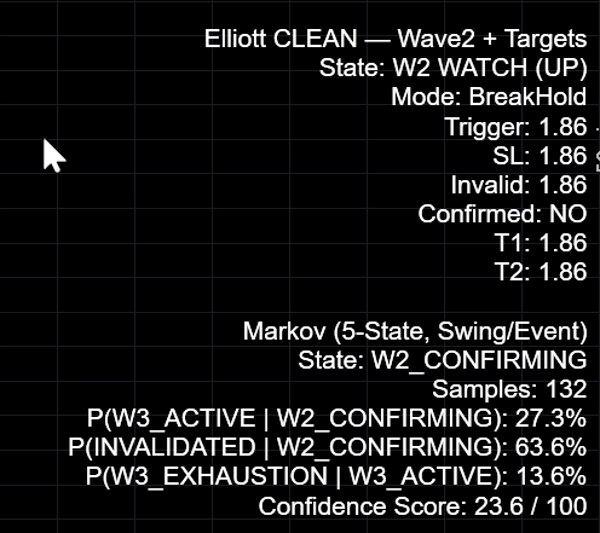
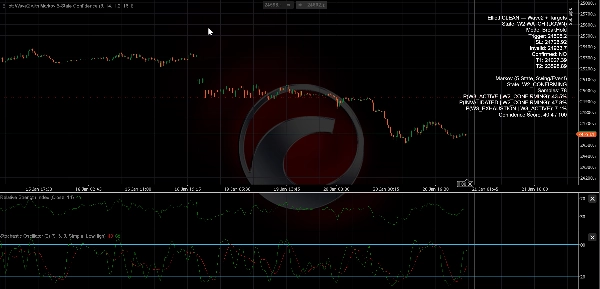
يطبع المؤشر مستويات الهيكل واحتمالات ماركوف مباشرة على الرسم البياني.
طبقة إليوت الأساسية:
- الحالة: W2 WATCH (صعود/هبوط) — موجة 2 محتملة موجودة (تم العثور على الهيكل)
- مؤكد: نعم/لا — تم تفعيل قاعدة التأكيد التي اخترتها
- المحفز — يجب أن يكسر السعر المستوى/يستعيده (يعتمد على الوضع)
- وقف الخسارة — مستوى وقف الحماية المقترح (يعتمد على وضع وقف الخسارة)
- الإبطال — مستوى الإبطال الهيكلي (بداية موجة 1)
- T1/T2 — توقعات موجة 3 باستخدام المضاعفات
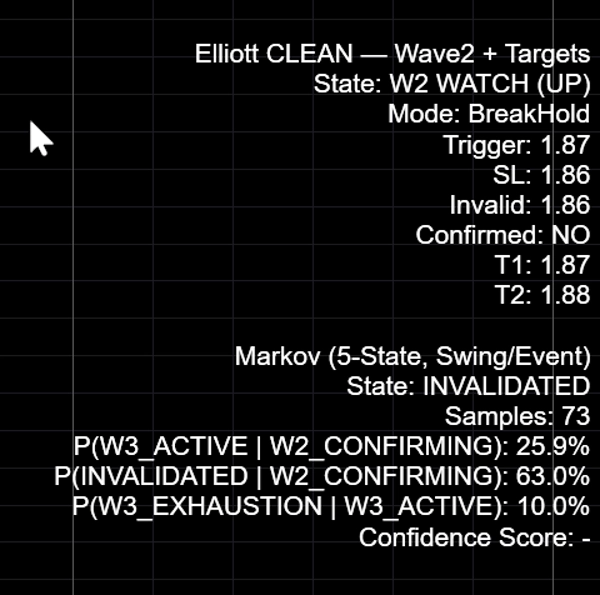
طبقة ماركوف:
- الحالة — حالة ماركوف الحالية (مثلاً
W2_CONFIRMING,W3_ACTIVE,INVALIDATED) - العينات — عدد العينات التاريخية المستخدمة في الاحتمالات
- P(W3_ACTIVE | W2_CONFIRMING) — فرصة تنشيط موجة 3 من مرحلة موجة 2
- P(INVALIDATED | W2_CONFIRMING) — فرصة فشل الإعداد خلال مرحلة موجة 2
- P(W3_EXHAUSTION | W3_ACTIVE) — فرصة فشل موجة 3 مبكرًا بمجرد تنشيطها
درجة الثقة (0–100)
درجة الثقة ليست معدل نجاح وليست ضمانًا. إنها مقياس جودة مشتق من التحولات الهيكلية التاريخية.
كيفية استخدام الدرجة:
- أثناء
W2_CONFIRMING، تعكس الدرجة "احتمالية التنشيط" معدلة بمخاطر الفشل المبكر. - أثناء
W3_ACTIVE، تعكس الدرجة "متانة الاستمرار" (مخاطر نفاد مبكر منخفضة).
فسر الدرجة دائمًا مع: (1) وضوح الهيكل، (2) مسافة الإبطال، و (3) حجم العينة.
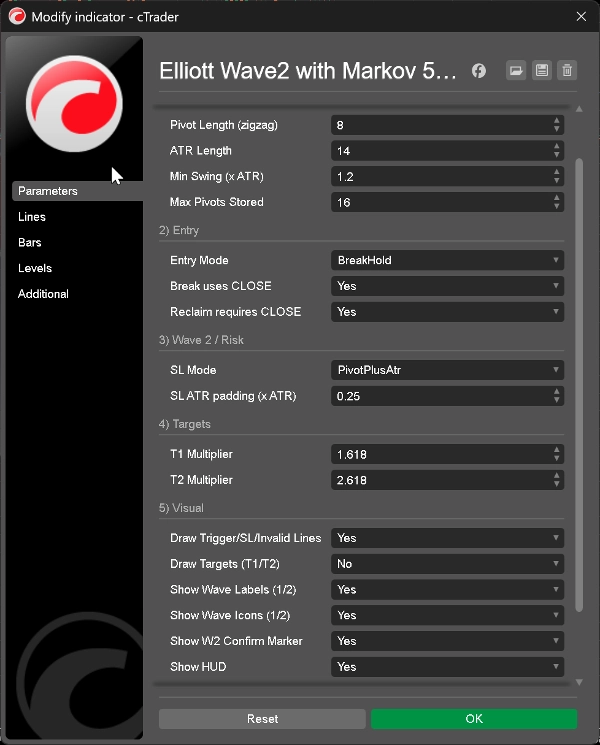
الإدخالات (ما تقوم به)
1) النقطة المحورية / الهيكل
- طول النقطة المحورية (الزجزاج): يتحكم في حساسية التقلبات. الأعلى = تقلبات أقل، هيكل أنظف.
- طول ATR: نافذة ATR المستخدمة لتصفية التقلبات وتوسيع وقف الخسارة الاختياري.
- الحد الأدنى للتقلب (×ATR): الحد الأدنى لحجم التقلب لقبول نقطة محورية (يصفّي الضوضاء).
- أقصى نقاط محورية مخزنة: يحد من تاريخ التقلبات المخزن (الأداء والاستقرار).
2) الدخول
- وضع الدخول: اختر أسلوب التأكيد:
-
BreakHold— أكثر أمانًا: كسر ثم ثبات بعد المحفزBreak— أسرع: كسر المحفز مرة واحدةReclaim— سلوك المسح والاستعادةWick— عدواني: فتيل عبر المحفز
- الكسر يستخدم الإغلاق: يستخدم الإغلاق بدلاً من الفتيل لمنطق الكسر (موصى به).
- الاستعادة تتطلب الإغلاق: يتطلب إغلاقًا على الجانب الصحيح بعد المسح.
3) موجة 2 / المخاطرة
- وضع وقف الخسارة: يحدد خط الأساس لوضع الوقف.
- توسيع وقف الخسارة ATR (×ATR): عازل إضافي عند استخدام وقف قائم على ATR.
4) الأهداف
5) العرض
- رسم خطوط المحفز/وقف الخسارة/الإبطال: إظهار/إخفاء المستويات الأفقية الأساسية.
- رسم الأهداف: خطوط الأهداف الاختيارية (أقل "نظافة").
- عرض تسميات / رموز الموجة: عرض علامات الموجة (1/2).
- عرض علامة تأكيد W2: يعرض علامة التأكيد.
- عرض HUD: إظهار/إخفاء واجهة المستخدم بالكامل.
كيفية الاستخدام:
- افحص عدة أسواق، ثم ركز فقط على البيئات الهيكلية عالية الجودة.
- استخدم الدرجة + حجم العينة لتقرر متى يكون الإعداد يستحق الوقت والمخاطرة.
الأسئلة الشائعة
هل يعمل هذا على جميع الرموز والأطر الزمنية؟
نعم. إنه نهج قائم على الهيكل. ستختلف النتائج والاحتمالات حسب سلوك السوق والتقلب.
هل درجة الثقة هي معدل نجاح؟
لا. إنها درجة جودة هيكلية مشتقة من تحولات الحالة التاريخية (نموذج ماركوف). لا تضمن النتائج.
لماذا تكون الدرجة غالبًا منخفضة أثناء موجة 2؟
لأن تنشيط موجة 3 انتقائي. يفشل العديد من مرشحي موجة 2 أو يتذبذبون. المؤشر مصمم لتصفية هؤلاء.
ماذا عن حجم العينة المنخفض؟
اعتبر الاحتمالات أقل استقرارًا عندما يكون حجم العينة صغيرًا. استخدم الدرجة كسياق، وليس يقينًا.
إخلاء مسؤولية المخاطر
التداول ينطوي على مخاطر وقد لا يكون مناسبًا لجميع المستثمرين. الأداء السابق والاحتمالية التاريخية لا تضمن النتائج المستقبلية. هذا المؤشر يوفر معلومات تحليلية فقط ولا يشكل نصيحة استثمارية أو توصية بالشراء أو البيع لأي أداة. أنت مسؤول عن قراراتك الخاصة، إدارة المخاطر، والامتثال للوائح المحلية.
موجة إليوت، هيكل السوق، التحليل الفني، الاحتمالية، التحليل الإحصائي، التداول بالتأرجح، إدارة المخاطر، دعم القرار
الملخص
تقييمات العملاء
5 | 100 % | |
4 | 0 % | |
3 | 0 % | |
2 | 0 % | |
1 | 0 % |


