
Descripción
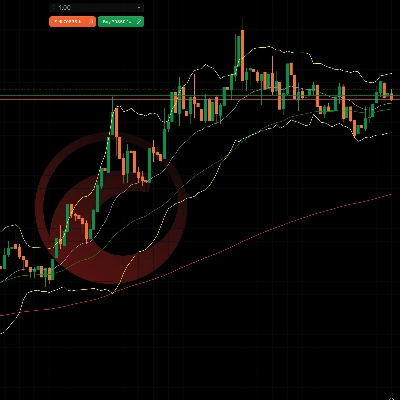
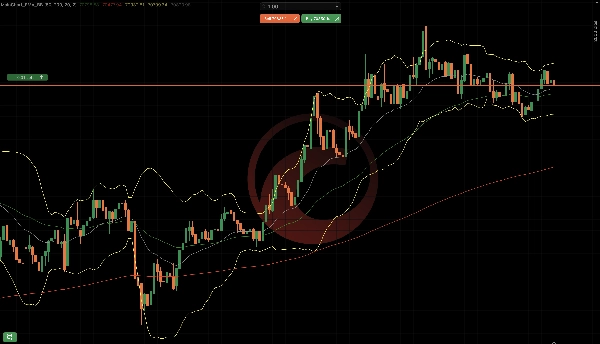
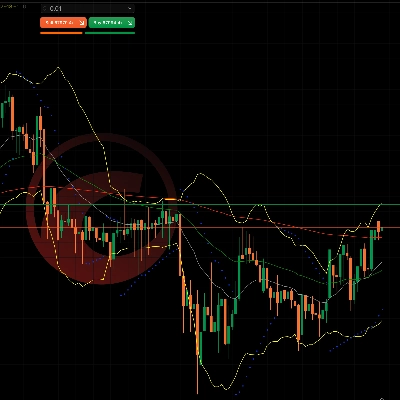
MainChart_EMA_BB es un indicador superpuesto en el gráfico principal para cTrader que combina:
- Medias Móviles Exponenciales (EMA 50 y EMA 200)
- Bandas de Bollinger (Superior / Media / Inferior)
Componentes del Indicador
Medias Móviles Exponenciales (EMA)
Dos EMAs están disponibles:
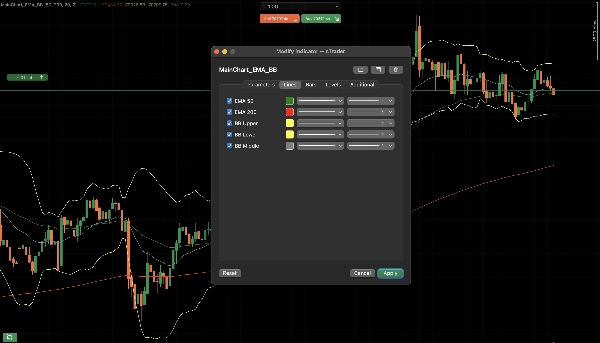
EMAPeríodo PredeterminadoColor Predeterminado
EMA 50
50
Verde
EMA 200
200
Rojo
Propósito:
- Dirección de la tendencia
- Soporte/resistencia dinámico
- EMA 50 por encima de EMA 200 → sesgo alcista
- EMA 50 por debajo de EMA 200 → sesgo bajista
Bandas de Bollinger
Las Bandas de Bollinger consisten en:
- Banda Superior
- Banda Media (basada en EMA)
- Banda Inferior
Configuración Predeterminada:
- Período: 20
- Desviación Estándar: 2.0
- Tipo de MA: Exponencial
Propósito:
- Medición de volatilidad
- Zonas de sobrecompra / sobreventa
- Precio tocando banda superior → posible agotamiento
- Precio tocando banda inferior → posible rebote
Parámetros Explicados
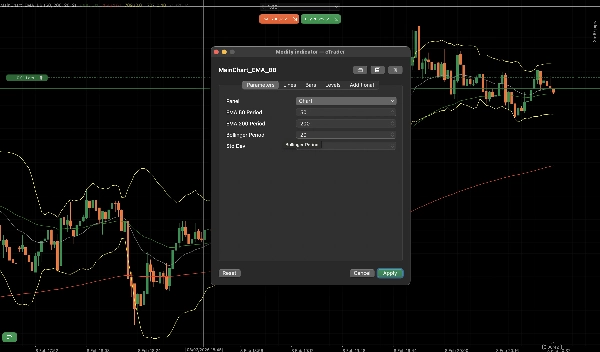
Parámetros EMA
- Mostrar EMA 50: Activar/desactivar EMA 50
- Período EMA 50: Período de cálculo
- Mostrar EMA 200: Activar/desactivar EMA 200
- Período EMA 200: Período de cálculo
Parámetros de Bandas de Bollinger
- Mostrar Bandas de Bollinger: Activar/desactivar BB
- Período BB: Período de retroceso
- Desviación Estándar BB: Multiplicador de volatilidad
Uso Típico en Trading
Confirmación de Tendencia
- EMA 50 por encima de EMA 200
- Preferir solo operaciones largas
Reversión / Retroceso
- El precio retrocede hacia EMA 50
- Compresión y luego expansión de la Banda de Bollinger
Lo bueno de este indicador es que es configurable y no es necesario configurar múltiples indicadores.
Resumen
AI summary
MainChart_EMA_BB is a main-chart overlay indicator designed for the cTrader platform. It integrates two key technical analysis tools: Exponential Moving Averages (EMA) and Bollinger Bands, providing a consolidated view on the price chart.
The indicator features two EMAs—EMA 50 (green) and EMA 200 (red)—used to identify trend direction and dynamic support/resistance levels. A bullish bias is indicated when EMA 50 is above EMA 200, while a bearish bias is signaled when EMA 50 is below EMA 200.
Bollinger Bands consist of an upper band, a middle band based on an exponential moving average, and a lower band. Default settings include a 20-period lookback and a standard deviation multiplier of 2.0. These bands measure market volatility and highlight overbought or oversold conditions, with price touching the upper band suggesting potential exhaustion and price touching the lower band indicating a possible bounce.
Users can configure parameters to enable or disable each EMA and Bollinger Bands, adjust their periods, and modify volatility multipliers. Typical usage includes trend confirmation—favoring long trades when EMA 50 is above EMA 200—and identifying reversals or pullbacks through price interaction with EMA 50 and Bollinger Band squeezes.
This indicator combines multiple analysis tools into one overlay, reducing the need for multiple separate indicators on the chart.
The indicator features two EMAs—EMA 50 (green) and EMA 200 (red)—used to identify trend direction and dynamic support/resistance levels. A bullish bias is indicated when EMA 50 is above EMA 200, while a bearish bias is signaled when EMA 50 is below EMA 200.
Bollinger Bands consist of an upper band, a middle band based on an exponential moving average, and a lower band. Default settings include a 20-period lookback and a standard deviation multiplier of 2.0. These bands measure market volatility and highlight overbought or oversold conditions, with price touching the upper band suggesting potential exhaustion and price touching the lower band indicating a possible bounce.
Users can configure parameters to enable or disable each EMA and Bollinger Bands, adjust their periods, and modify volatility multipliers. Typical usage includes trend confirmation—favoring long trades when EMA 50 is above EMA 200—and identifying reversals or pullbacks through price interaction with EMA 50 and Bollinger Band squeezes.
This indicator combines multiple analysis tools into one overlay, reducing the need for multiple separate indicators on the chart.
Perfil del indicador
Valoraciones de clientes
4.3
Valoraciones: 3
5 | 33 % | |
4 | 67 % | |
3 | 0 % | |
2 | 0 % | |
1 | 0 % |
Valoraciones de clientes
February 16, 2026
a 1R exit plan makes review easier, and messy areas become easier to avoid.
February 15, 2026
February 9, 2026
Conversación
Preguntas frecuentes
Prop
Forex
Indices
Commodities
Crypto
Stocks
Bollinger
Los productos disponibles a través de cTrader Store, incluidos bots, indicadores y plugins para operar, son proporcionados por desarrolladores de terceros y están disponibles únicamente con fines informativos y de acceso técnico. cTrader Store no es un bróker, por lo que no proporciona asesoramiento de inversión, recomendaciones personales ni ninguna garantía de rentabilidad futura.
Más de este autor


















Precio

Desde 01/04/2025