present
注册即可在首次购物时获得 $50 优惠
Trading product for Donchian Channel with Timeframe Context 指标 Donchian Channels, image 1
Donchian Channel with Timeframe Context
指标
版本 1.0, Feb 2026
Windows 版、Mac 版
Trading product for Donchian Channel with Timeframe Context 指标 Donchian Channels, image 2
Trading product for Donchian Channel with Timeframe Context 指标 Donchian Channels, image 3
Trading product for Donchian Channel with Timeframe Context 指标 Donchian Channels, image 4
Trading product for Donchian Channel with Timeframe Context 指标 Donchian Channels, image 5
Trading product for Donchian Channel with Timeframe Context 指标 Donchian Channels, image 6
注册日期 28/01/2026
4
销售

说明

理念

一个唐奇安通道,添加了更高时间框架的区间背景,而不是孤立地查看每次突破。


问题

标准的唐奇安通道告诉你价格何时达到最近的极值。

但突破并非孤立发生。

M15上的突破可能很重要——也可能只是价格在更大的日线或周线区间内波动。

因此,同一突破在更高时间框架区间内的位置不同,背景也会截然不同。

通道显示突破,但单独的通道无法显示该突破在更大区间中的位置。


核心概念:通道显示走势。更高时间框架显示发生的位置。

突破不仅是一个事件。

它还有一个位置。

两个突破在执行时间框架上可能看起来完全相同,但它们在更高时间框架区间中的位置却大相径庭。

一个可能发生在更大区间的中部附近。

另一个可能直接发生在其上边界内。

价格走势可能看起来相同。

背景却不同。

该指标通过将之前完成的更高时间框架区间直接放置在当前图表上,使该背景可见。

不仅仅问:

“价格突破了通道吗?”

你还可以问:

“突破发生在哪里?”


它的功能

带时间框架背景的唐奇安通道在单一图表上结合了两层信息:

1. 当前时间框架的唐奇安通道

标准唐奇安通道追踪当前市场的最近高点、低点和中点。

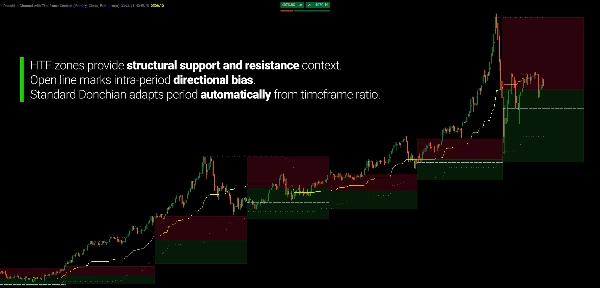
其周期根据你的图表时间框架与所选背景时间框架的比例自动计算。例如,周线背景在H1图表上产生120根K线的回溯。

你无需决定通道应使用20、50还是100根K线。

时间框架关系定义了回溯周期。

2. 更高时间框架背景

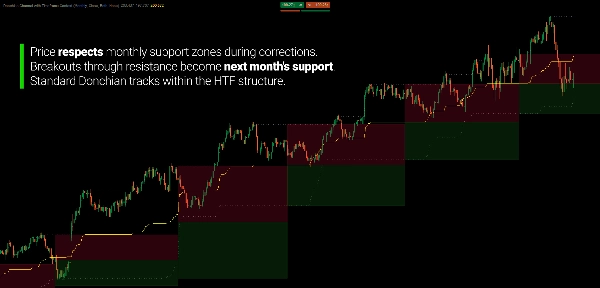
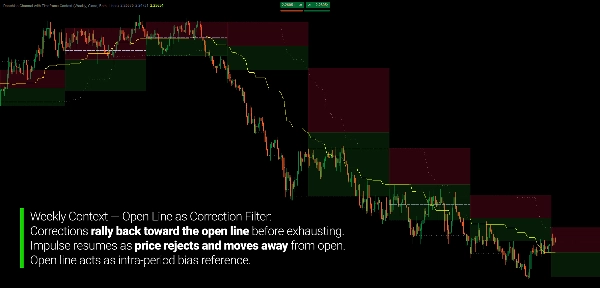
之前完成的更高时间框架周期的区间被投射到当前图表上,作为支撑和阻力区域。

其区间分为两个区域:

支撑区
从前一周期的低点到其中点。

阻力区
从中点到前一周期的高点。

随着价格在当前时间框架上的发展,你可以立即看到其在更大区间内的位置。


两个时间框架。一张图表。

当前时间框架的唐奇安通道显示围绕最近极值的发展走势。

更高时间框架的区间提供更大的参考框架。

例如:

周线背景 → H1图表

或

日线背景 → M5图表

较低时间框架保持为活跃走势。

较高时间框架仅提供周围区间。

通道显示价格的动作。更高时间框架显示发生的位置。


更高时间框架不会覆盖较低时间框架

更高时间框架的区间不是告诉你价格必须做什么的信号。

它是一个参考框架。

较低时间框架的突破可以穿越更高时间框架的阻力。

回调可以停留在更高时间框架的支撑内。

价格也可以完全超出之前的区间,进入新领域。

目的不是预测哪种结果会发生。

而是在你观察较小走势发展的同时,使更大区间可见。


让背景自动更新

更高时间框架的区域基于之前完成的周期。

当新的更高时间框架周期开始时,背景区间会更新。

例如:

上一周 → 当前周

上一周的高点、低点和中点成为当前周的参考。

在H1图表上,这些边界保持可见,而当前周期的唐奇安通道继续发展。

因此,你获得了一个持久的参考,而无需手动绘制之前周期的区间。


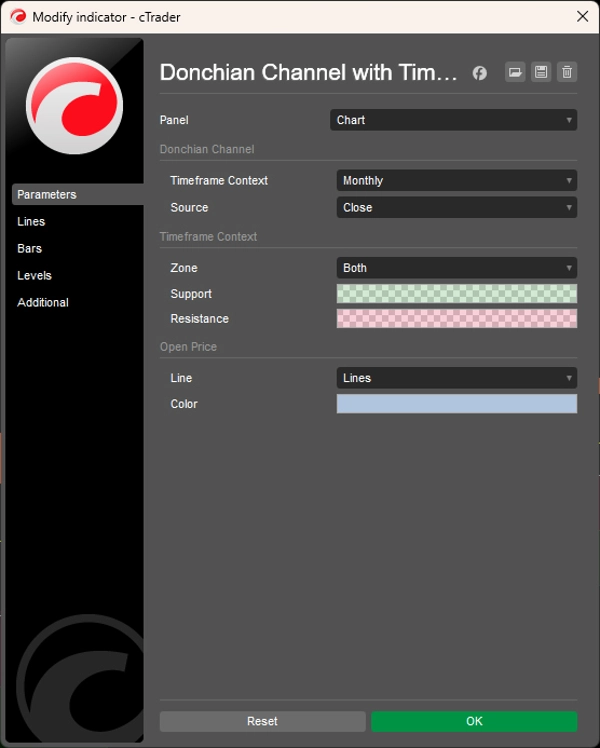
时间框架背景由你选择

选择提供你想要背景的更高时间框架:

  • 月线
  • 周线
  • 日线
  • 4小时
  • 1小时
  • 30分钟
  • 15分钟
  • 以及其他支持的组合

指标会自动处理相应的唐奇安周期。

你选择背景,计算自动适应。


可选的开盘价参考

当前更高时间框架周期的开盘价也可以显示。

这为你提供了另一个参考,显示价格相对于当前更高时间框架周期开盘价的交易位置。

当你需要额外背景时启用它。

当你想让图表专注于两个唐奇安层时隐藏它。


选择通道的计算方式

唐奇安边界可以基于以下方式计算:

收盘价

或

最高价 / 最低价

基于收盘价的计算产生基于收盘价的边界。

最高/最低价计算包括完整的影线极值,因此代表更宽的价格区间。

相同的来源选择会一致应用于当前时间框架和更高时间框架的计算。


为背景设计,而非追逐信号

带时间框架背景的唐奇安通道不是突破预测系统。

它不会告诉你突破是否会成功。

它为你提供一个明确的环境来观察突破。

用它来研究:

  • 突破
  • 回调
  • 更高时间框架边界
  • 在更大区间内的位置
  • 超越之前极值的扩展
  • 多时间框架价格几何
  • 相对于前一周期的当前走势

标准唐奇安告诉你当前极值的位置。

更高时间框架背景告诉你这些极值在更大区间中的位置。


主要特点

  • 标准唐奇安通道
  • 自动计算当前时间框架周期
  • 更高时间框架区间投射
  • 支撑和阻力背景区域
  • 前一周期的高点、低点和中点
  • 13种可选时间框架背景,从月线到15分钟
  • 可选的更高时间框架开盘价
  • 收盘价或最高/最低价计算模式
  • 可配置的区域显示:全部、仅支撑、仅阻力或无
  • 仅支撑/仅阻力显示选项
  • 实时更新
  • 支持基于时间和非基于时间的图表,包括Tick、Renko和区间图


---


交易涉及风险。该指标是技术分析工具,应结合适当的风险管理一起使用。

摘要

AI summary
The Donchian Channel with Timeframe Context indicator enhances the traditional Donchian Channel by overlaying higher-timeframe structural support and resistance zones onto the current chart. It calculates the previous higher-timeframe period's price range and projects these as colored zones—support below the midpoint and resistance above—providing a multi-timeframe context for breakout and pullback analysis.

This dual-layer system automatically adapts the Donchian lookback period based on the ratio between the selected higher timeframe and the chart timeframe, eliminating manual period settings. It supports 13 timeframe options from Monthly to 15 Minutes and can be applied across various markets including forex pairs (EURUSD, GBPUSD, USDJPY, NZDUSD), commodities (XAUUSD), indices (NAS100), and cryptocurrencies (BTCUSD).

Key features include real-time updates of both standard and higher-timeframe channels, configurable visual zones with adjustable colors and transparency, an optional open price line marking the higher-timeframe period’s open, and flexible price source settings (close or high/low).

The indicator aids traders in filtering false breakouts by showing whether price movements occur within structural supply or demand zones on a higher timeframe. It is designed for trend-following, swing, and discretionary traders who use Donchian channels and seek enhanced structural context to better assess breakout significance and correction exhaustion without switching timeframes.
指标配置

客户评价

0.0
评价:0
客户评价
该产品尚无评价。已经试过了?抢先告诉其他人!

讨论

常见问答

Donchian Channels
cTrader Store 提供的所有产品,包括交易机器人、指标和插件,均由第三方开发者提供,仅供信息参考和技术访问之用。cTrader Store 并非经纪商,不提供投资建议、个人推荐或任何未来业绩保证。

该作者的其他作品

指标
Supertrend
Moving Average
Adaptive MA anchored to structural trend changes — no fixed period. Dual Supertrend + swing detection.
指标
Fibonacci
Auto-swing detection driving 7 Fibonacci projections: retracement, expansion, fan, time, pitchfork, channel, Gann.
指标
EMA
SMA
+2
Drag MA to any swing point — MA anchors and recalculates instantly. Not period-based. Structural.
指标
Channel
Fibonacci
Anchor-based Fibonacci channel that grows with the market. Seven display modes, auto-direction, fully draggable.
指标
Volume
Custom range volume profile between two draggable anchors. Auto source timeframe, Total/Up-Down/Delta, POC, Value Area.
指标
RSI
RSI on the main chart with 45/55 momentum levels, overbought/oversold levels, averaged RSI, and multi-timeframe support.

猜您喜欢

指标
ATR
RSI
+17
Turn data into precision trades with AlphaTrend Pro Max — advanced trend, signal & structure analysis in one.
指标
RSI
MACD
+7
The ZigZag indicator is a technical analysis tool primarily used to identify key price reversal points.
指标
Signal
Fractal Arrow Buy and Sell Indicator
指标
Volume
Custom range volume profile between two draggable anchors. Auto source timeframe, Total/Up-Down/Delta, POC, Value Area.
指标
Fisher Transform with smoothing. Spot reversals and cycles with precision. Great for any market, any timeframe.
指标
Market Structure
Stop guessing which trading session you in, with Sessions indicator sessions are in your finger tips like a pro
指标
ATR
Wedge
+2
Strong Supertrend Turn Market Movement into a Clear Map Market analysis
指标
ADX
ATR
+5
Ten confluence layers scored on every closed bar, with an anti-chop gate, pivot levels and a live dashboard.
指标
Imbalance
Fair Value Gap
+1
Multi-symbol, multi-timeframe Fair Value Gaps in one panel.
指标
Prop
VWAP
+5
VWAP is a powerful tool for intraday traders
指标
Forex
Crypto
+5
🚀 Automated Elliott Wave & Fibonacci tool for cTrader. Spot trends, corrections & retracements fast.
指标
Volume
Key Levels
View tick activity across a selected chart range with Point of Control, Value Area High and Value Area Low.
指标
SMC
VWAP
+4
Killzone Session and key levels with VWAP – Precision Meets Price Action
指标
ATR
Prop
+7
Smart momentum tool uses advanced filtering and colour cues for clearer market direction and trading signals.
指标
CandleColourFlow MultiFx - optimized to work on Fx Majors, Fx MInors, Fx Crosses
指标
Doji
Volume
+5
Instantly spot high-liquidity institutional moves with clean, non-obtrusive triangle alerts on cTrader charts.
指标
SMC
Forex
+5
Detects Break of Structure (BOS) and Change of Character (CHOCH)
指标
ATR
Prop
+13
Enhance trading with ATR Bands! Visualize market volatility using dynamic upper and lower ATR bands for precise decision

价格

注册日期 28/01/2026
4
销售