

present
注册即可在首次购物时获得 $50 优惠
Trading product for FXB Confluence Engine 指标 ADX EMA, image 1
FXB Confluence Engine
指标
版本 1.0, Sep 2026
Windows 版、Mac 版
Trading product for FXB Confluence Engine 指标 ADX EMA, image 2
Trading product for FXB Confluence Engine 指标 ADX EMA, image 3
Trading product for FXB Confluence Engine 指标 ADX EMA, image 4
Trading product for FXB Confluence Engine 指标 ADX EMA, image 5
Trading product for FXB Confluence Engine 指标 ADX EMA, image 6
Trading product for FXB Confluence Engine 指标 ADX EMA, image 7
Trading product for FXB Confluence Engine 指标 ADX EMA, image 8
Trading product for FXB Confluence Engine 指标 ADX EMA, image 9
Trading product for FXB Confluence Engine 指标 ADX EMA, image 10
Trading product for FXB Confluence Engine 指标 ADX EMA, image 11

说明

FXB Confluence Engine is a trend and signal indicator that scores ten independent conditions on every closed bar and shows you exactly how it arrived at the number.


WHAT IT DRAWS


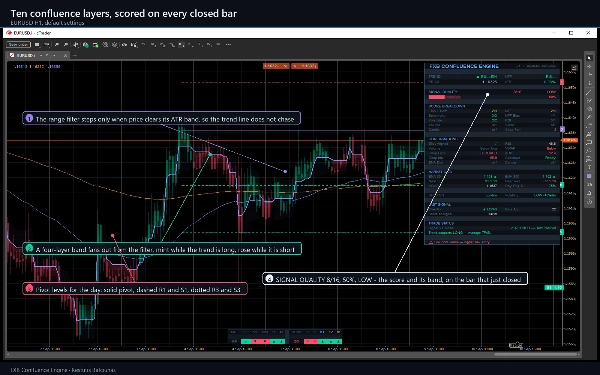
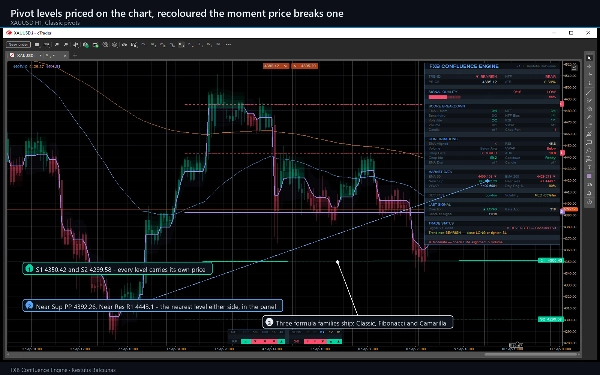
A range-filter trend line that steps only when price clears its ATR band, so it does not chase. A four-layer gradient band around it, coloured with the trend. Buy and sell markers on closed bars. Pivot levels for the period you choose, each priced on the chart and recoloured the moment price breaks one. Two EMAs with slope arrows. And a four-column dashboard that is the point of the product.


THE TEN LAYERS


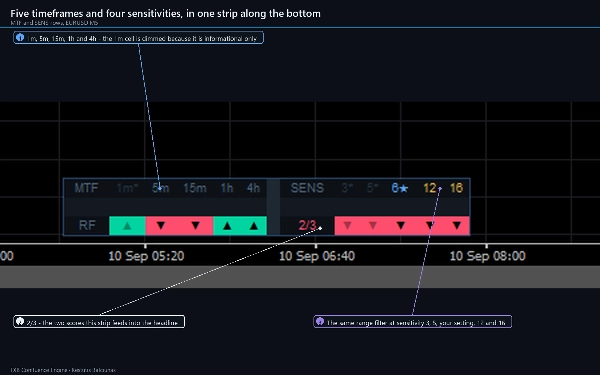
Higher-timeframe bias. Multi-timeframe agreement across 5m, 15m, 1h and 4h. A sensitivity cross-check that runs the same filter at three other settings. EMA and momentum alignment over three lookbacks. Volatility rank and percentile. RSI. Volume against its average. VWAP. Candle structure. Less an anti-chop penalty.


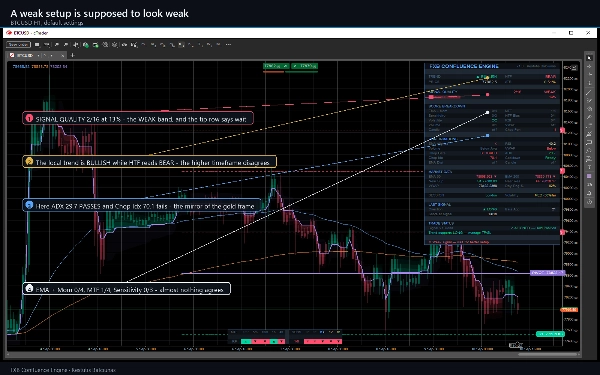
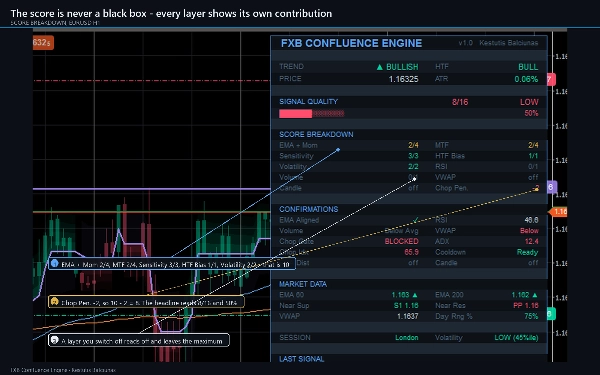
Each layer contributes a bounded score, and the dashboard prints every one of them separately. When the headline reads 8/16 you can see which five layers agreed, which three did not, and what the penalty was. A layer you switch off reads "off" and leaves the maximum, so the denominator follows your settings.


THE ANTI-CHOP GATE


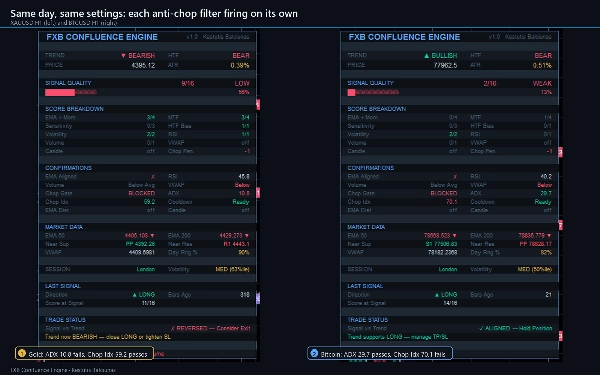
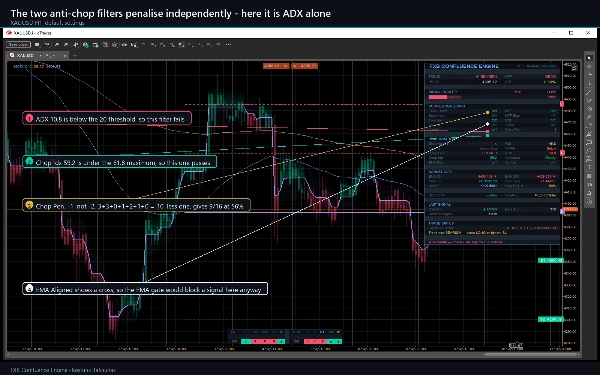
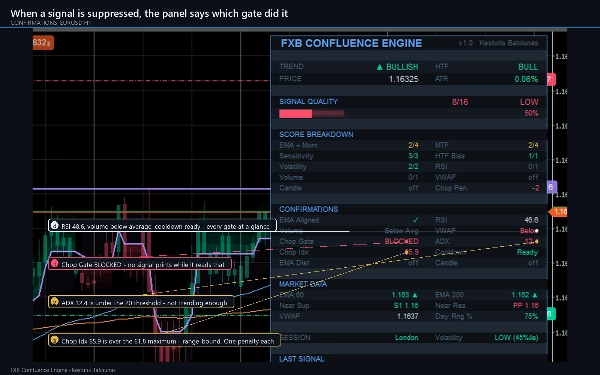
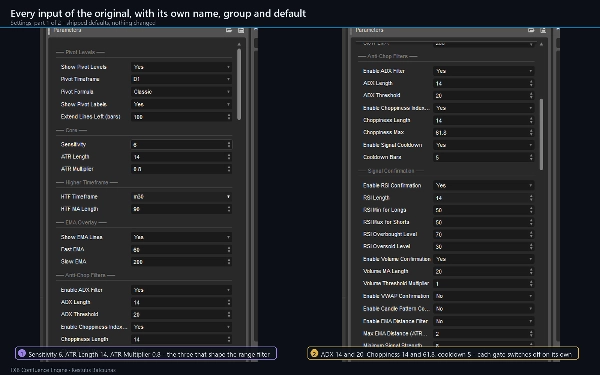
Two independent filters decide whether a signal is allowed at all: ADX for trend strength and the Choppiness Index for range-bound conditions, plus a cooldown that stops a whipsaw firing twice. Each failing filter costs one point and the dashboard names it, so a suppressed signal is never a mystery - the ADX and Chop Idx rows tell you which one is holding the gate shut.


REPAINTING


Signals are computed on closed bars and do not repaint. The trend line, the band, the background tint and the bar colouring intentionally follow the live bar and will move within it. The arrows and the score do not.


ALERTS


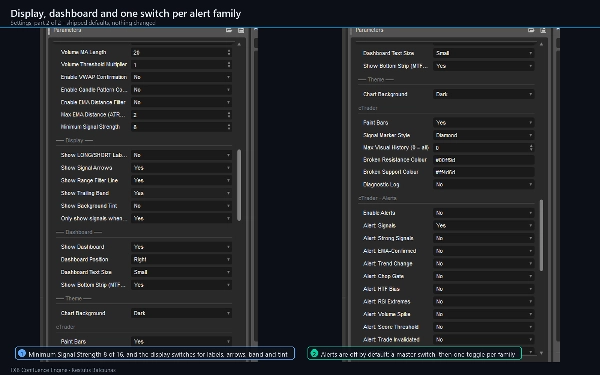
Ten alert families covering nineteen conditions: signals, strong signals, EMA-confirmed signals, trend changes, chop-gate transitions, higher-timeframe bias flips, RSI extremes, volume spikes, score-threshold crossings and trade invalidation. All off by default, all closed-bar only, all deduplicated per bar, and none of them fire while the indicator is loading history.


INDICATOR TYPE AND WINDOW


An overlay indicator: it draws on the price chart, not in a separate pane.


RECOMMENDED TIMEFRAMES AND INSTRUMENTS


Built and tested from 1-minute to Daily, with 5m, 15m, 1H and 4H the most useful at the default settings. It runs unchanged on forex majors and crosses, gold and silver, indices, crypto and the larger stocks.


WHO IT IS FOR


Traders who want a second opinion before taking a setup, and who would rather see why a signal was rejected than be shown a bare arrow. It suits discretionary traders reading structure, and anyone who wants a multi-timeframe check without stacking six charts.


WHAT IT DOES NOT DO


It places no orders and manages no positions. It has no access rights: it reads market data and draws. It is an analysis and alerting tool, and every decision remains yours.


SETTINGS


65 parameters in nine groups, all documented, with sensible defaults you can leave alone. The shipped configuration is the intended one.


REQUIREMENTS


cTrader 5.9 or later, any broker. The volume and VWAP layers need a feed that carries volume; the other eight layers work on any feed.


TRIAL


A trial edition is attached to this product. It is the complete indicator with a single restriction: it runs on EURUSD only, with any broker suffix accepted. There is no time limit and no feature is removed. The full version removes the symbol restriction, and that is the only difference between them.


SUPPORT


Use the Discussion tab. Please include your broker, symbol, timeframe, cTrader version and a screenshot showing the dashboard - it displays the state of every gate and usually answers the question by itself.


Trading involves risk. Past performance does not guarantee future results.

摘要

指标配置
指标分类
趋势
输出类型
可视化
信号
数据要求
仅 K 线
交易量
支持的信号
交叉
趋势强度
反转
突破水平位

客户评价

0.0
评价:0
客户评价
该产品尚无评价。已经试过了?抢先告诉其他人!

讨论

常见问答

ADX
EMA
Key Levels
Volume
Market Structure
ATR
VWAP
cTrader Store 提供的所有产品,包括交易机器人、指标和插件,均由第三方开发者提供,仅供信息参考和技术访问之用。cTrader Store 并非经纪商,不提供投资建议、个人推荐或任何未来业绩保证。

该作者的其他作品

指标
ATR
BOS
+5
Know how strong each Supertrend flip is: scored BUY/SELL, structure stop + 3 targets, live win-rate dashboard, alerts.
指标
ADX
ATR
+5
Scored breakouts of sloped pivot trendlines: four filters on the break bar, ATR stop, 1:1 / 1:2 / 1:3 targets, alerts.
指标
ATR
RSI
+5
Supply and demand zones with break of structure, higher timeframe MA signals, a percent stop and three targets.
指标
ATR
Volume
+3
Fibonacci trend signals on closed bars, with an ATR stop, up to four targets and a break-even ladder.
指标
Volume
Channel
+3
A higher-timeframe log-regression channel with a volume profile, Point of Control and session levels.
指标
Volume
Key Levels
+1
Fixed-grid volume profile: bull and bear volume at every price level, with Point of Control and value area.
指标
ADX
ATR
+5
SuperTrend signals scored on five confluence factors, with an ATR stop, three targets and a dashboard.

猜您喜欢

指标
RSI
Signal
+2
Dynamic circles visualize price's volatility position. Like RSI for market overextension & stretch. Quantify context.
指标
Key Levels
Support & Resistance
Clean psychological round-number grid with native pip and point auto-scaling across Forex, Gold, Indices, and Crypto.
指标
SMA
Volume
+3
Stoc​h PRO Quad Rotation Signal (QRS) is an advanced technical analysis indicator developed for cTrader.
指标
ATR
Volume
+2
Heatmap Liquidity Zones Visualize volume-at-price, uncover hidden support/resistance, and track market liquidity in real
指标
ATR
RSI
+5
Supply and demand zones with break of structure, higher timeframe MA signals, a percent stop and three targets.
指标
AI
ATR
+26
Liquidity Cluster Order automatically detects and draws accumulation zones & distribution zones
指标
BOS
MSS
+2
Stay ahead with a real-time countdown to candle closes on all key timeframes: 5m, 15m, 30m, 1H, 4H, and Daily.
指标
Signal
Fractal Arrow Buy and Sell Indicator
"KANDIKA HEAT MAP" 标识
评分最高
4.6
(5)
$19
指标
Color-Based Market Pressure & Volatility Visualizer The Kandika Heatmap Indicator
指标
Forex
EURUSD
+7
Institutional Session Levels Pro OHLC,Prev(D,W,M OHLC)
指标
RSI
SMC
+17
RSI, MACD, Stochastic, CCI & Momentum divergence scanner with confluence scoring. Never miss a signal again!
指标
XAUUSD
Commodities
A Fair Value Gap (FVG) indicator that identifies potential price imbalances, potential reversal and continuation zones
指标
MACD
Prop
+14
Enhance MACD Histogram! Visualize bull and bear price changes with vibrant colors for clearer, more insightful trading.
指标
ATR
Prop
+15
Initial Range – Where the open writes the script.
指标
BOS
MSS
+3
Orderblocks with Multi-Timeframe.
指标
Forex
BTCUSD
+9
This indicator implements an Opening Range Breakout (ORB) trading strategy, designed to capture momentum during the most
指标
Volume
Channel
+5
Spots volatility squeezes before they fire — the compression phase everyone else misses.
指标
EMA
RSI
+5
Keep your focus with smart on-chart notes. Features Markdown, 6 themes, and auto-save per symbol for manual trading.When

价格





























