


Description
L'IDÉE
Un profil de volume qui s'adapte au mouvement exact des prix défini par la plage sélectionnée au lieu de forcer l'analyse dans une période prédéfinie.
LE PROBLÈME
La plupart des outils de profil de volume sont construits autour de périodes prédéfinies.
Sessions. Jours. Semaines. Retours fixes.
Mais le mouvement des prix que vous souhaitez étudier ne correspond que rarement parfaitement à ces limites.
Une jambe de tendance peut commencer en milieu de session.
Une correction peut s'étendre sur plusieurs périodes.
Un mouvement d'un swing à l'autre peut commencer et se terminer n'importe où sur le graphique.
Le problème n'est pas nécessairement le profil de volume lui-même.
Le problème est de laisser la période temporelle décider quel mouvement de prix est analysé.
LE CONCEPT FONDAMENTAL : DÉFINIR LA PLAGE. LAISSER LE PROFIL S'Y ADAPTER.
Le profil de volume à plage personnalisée inverse cette relation.
Au lieu de demander :
"Quelle période le profil doit-il analyser ?"
vous définissez :
"Quel mouvement de prix veux-je analyser ?"
Deux ancres définissent la plage.
L'indicateur mesure le plus haut plus haut et le plus bas plus bas entre les deux ancres, puis construit le profil de volume à l'intérieur de cette plage de prix.
Cela fait du mouvement des prix la référence principale plutôt qu'une période prédéfinie.
Vous définissez la plage. Le profil s'y adapte.
CE QU'IL FAIT
Placez deux ancres sur les barres que vous souhaitez étudier.
L'indicateur construit automatiquement un profil de volume pour cette plage en utilisant la période source sélectionnée.
Déplacez l'une ou l'autre des ancres, et le profil se recalcule immédiatement.
Vous pouvez donc définir et redéfinir le mouvement directement depuis le graphique sans être contraint par les limites de session, les retours fixes ou d'autres périodes prédéfinies.
Utilisez-le pour étudier :
- Une jambe de tendance entière
- Une correction ou consolidation
- Le mouvement entre deux points de swing
- Une impulsion spécifique et son retracement
- Tout autre mouvement de prix important pour votre analyse
Le profil montre alors où le volume s'est accumulé à l'intérieur de ce mouvement spécifique.
PÉRIODE SOURCE AUTOMATIQUE
La plage sélectionnée et la période utilisée pour calculer son profil ne doivent pas nécessairement être les mêmes.
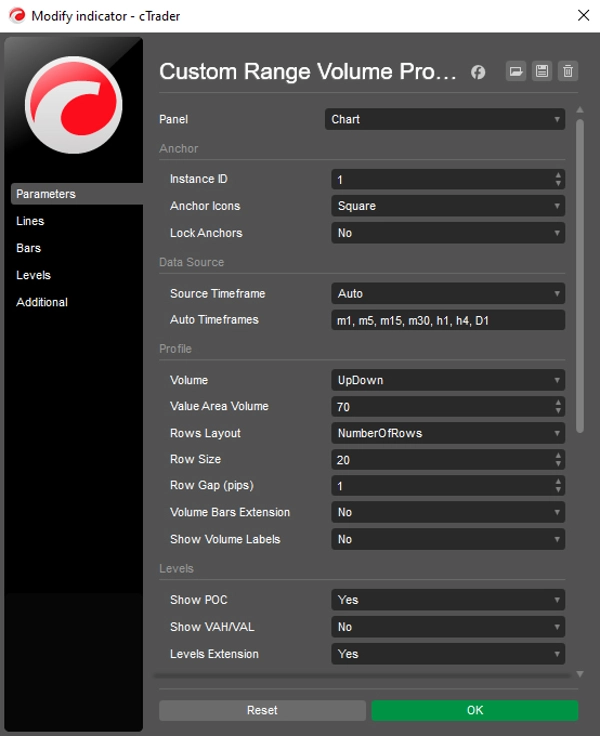
Lorsque le mode Auto est activé, l'indicateur parcourt votre liste de périodes configurées et sélectionne la période la plus fine capable de couvrir la plage sélectionnée tout en restant dans la limite de traitement de 5 000 barres.
Cela permet d'analyser une large plage historique en utilisant une période source plus fine que celle du graphique que vous visualisez, lorsque cela est possible.
Par exemple :
Graphique H4 → plage sélectionnée sur plusieurs jours → période source plus fine comme M1, M5 ou M15
Vous pouvez également désactiver le mode Auto et utiliser directement la période du graphique.
TROIS FAÇONS DE LIRE LE PROFIL
Choisissez comment vous souhaitez examiner la distribution du volume :
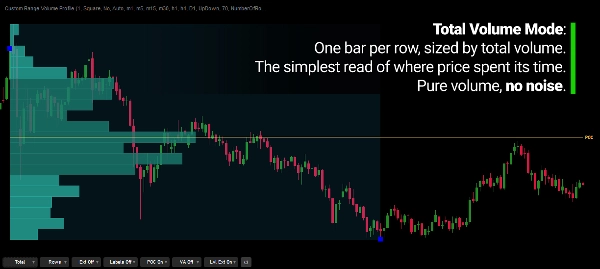
Total
Affiche le volume total à chaque ligne de prix, facilitant la visualisation des zones d'activité concentrée.
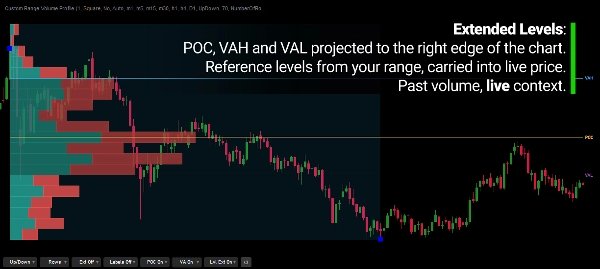
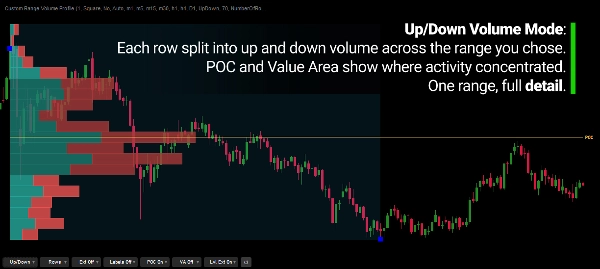
Haut / Bas
Divise le volume selon que la barre source s'est clôturée au-dessus ou en dessous de son ouverture.
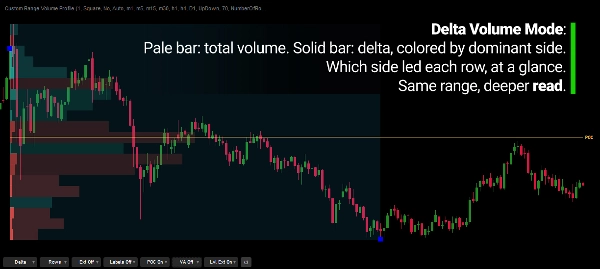
Delta
Affiche le volume total ainsi que la différence entre le volume haussier et baissier.
Le mode d'affichage peut être changé directement depuis les contrôles sur le graphique sans rouvrir les paramètres de l'indicateur.
NIVEAUX CLÉS
Le profil peut afficher :
- Point de Contrôle (POC) — la ligne de prix avec le volume le plus élevé
- Valeur Haute (VAH)
- Valeur Basse (VAL)
- Pourcentage configurable de la zone de valeur, par défaut 70%
- Extensions de niveau optionnelles
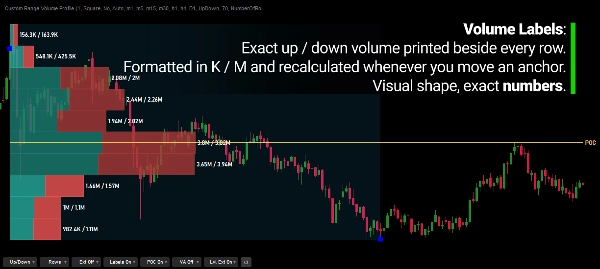
- Étiquettes de volume
Ces niveaux fournissent des références supplémentaires pour comprendre où l'activité s'est concentrée dans le mouvement sélectionné.
LA PLAGE RESTE SOUS VOTRE CONTRÔLE
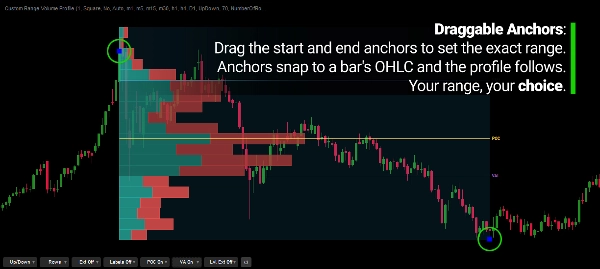
Les ancres peuvent être déplacées directement sur le graphique, verrouillées pour éviter tout déplacement accidentel, et peuvent s'accrocher à :
- Ouverture
- Haut
- Bas
- Clôture
Cela vous donne un contrôle précis sur ce qui est inclus dans le profil.
Changez le point de départ.
Changez le point d'arrivée.
Changez le mouvement que vous étudiez.
Le profil suit la plage.
PROFILS MULTIPLES. RÉFÉRENCES MULTIPLES.
Plusieurs profils indépendants peuvent être affichés sur le même graphique.
Chaque profil peut avoir sa propre plage et ses propres paramètres, permettant d'analyser simultanément différents mouvements de prix.
Par exemple, un profil peut représenter une impulsion tandis qu'un autre couvre sa correction.
Les plages restent indépendantes.
RÉSOLUTION DE PROFIL FLEXIBLE
Choisissez comment le profil divise le prix :
Lignes Cibles
Définissez le nombre approximatif de lignes de prix, la taille du tick par ligne étant automatiquement sélectionnée pour se rapprocher le plus possible de cet objectif.
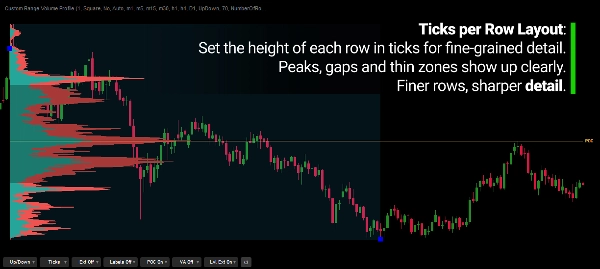
Ticks par ligne
Définissez la résolution des prix directement par le nombre de ticks assignés à chaque ligne.
Cela permet de visualiser le profil à différents niveaux de granularité selon le mouvement étudié.
CONTRÔLES SUR LE GRAPHIQUE
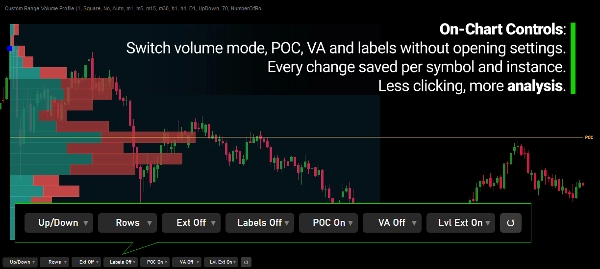
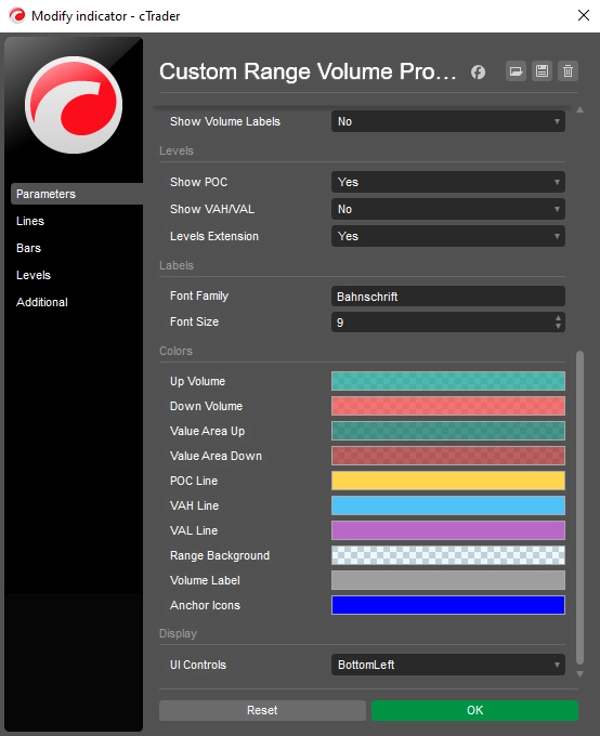
Les paramètres fréquemment utilisés peuvent être ajustés directement depuis le graphique.
Changez :
- Mode volume
- Disposition des lignes
- Extensions
- Étiquettes
- Visibilité du POC
- Visibilité de la zone de valeur
sans rouvrir plusieurs fois les paramètres de l'indicateur. La barre de contrôle peut être positionnée dans n'importe quel coin ou cachée, et les modifications sont sauvegardées par symbole et par instance.
AFFICHAGE PERSONNALISABLE
La présentation visuelle peut être ajustée pour s'adapter à votre flux de travail.
Personnalisez des éléments tels que :
- Couleurs
- Polices
- Étiquettes
- Extensions
- Autres paramètres d'affichage
Le calcul sous-jacent reste indépendant de la présentation visuelle.
LECTURE DU PROFIL
Un profil de volume décrit où l'activité s'est accumulée à travers les prix pendant la plage sélectionnée.
Les zones à volume élevé indiquent des prix où plus d'activité a eu lieu, tandis que les zones fines indiquent des prix avec moins de volume accumulé.
La forme du profil peut fournir un contexte utile :
- Volume concentré → activité accumulée autour de cette zone de prix
- Zones fines entre des nœuds plus lourds → activité relativement moins accumulée à travers ces prix
- POC près d'un bord de la plage → l'activité s'est concentrée vers un côté du mouvement sélectionné
Ce sont des observations sur ce qui s'est déjà passé.
Ce ne sont pas des prédictions de ce que le prix doit faire ensuite.
DONNÉES & CALCUL
Cet indicateur utilise le volume tick fourni par le flux de données de votre courtier.
Le volume de chaque barre source est réparti sur la plage de prix de cette barre.
Les modes Haut/Bas et Delta classifient les barres source selon leur ouverture et leur clôture.
Ainsi, Delta représente le volume directionnel des barres, et non le flux réel d'ordres bid/ask de la bourse.
Le résultat est une approximation cohérente et reproductible de la distribution du volume pour la plage que vous choisissez.
CONÇU POUR L'ANALYSE DE PLAGE DE PRIX
Le profil de volume à plage personnalisée est conçu pour étudier la distribution du volume à l'intérieur d'un mouvement de prix défini, plutôt que de profiler automatiquement une période temporelle arbitraire.
Utilisez-le pour examiner :
- La distribution du volume dans les tendances
- Impulsions et corrections
- Mouvements d'un swing à l'autre
- Zones à volume élevé et faible
- POC et zone de valeur
- Acceptation des prix et zones d'activité plus fines
- Différentes distributions de volume selon les mouvements de prix
- Plages indépendantes multiples sur le même graphique
L'indicateur ne décide pas quel mouvement est important.
Vous définissez la plage. Il construit le profil.
CARACTÉRISTIQUES PRINCIPALES
- Deux ancres de plage déplaçables avec verrouillage optionnel
- Accrochage des ancres à l'ouverture, au plus haut, au plus bas ou à la clôture
- Profilage personnalisé de la plage de prix
- Sélection automatique de la période source à partir d'une liste configurable
- Option de période source manuelle
- Modes Total / Haut-Bas / Delta
- Point de Contrôle
- Valeur Haute / Basse
- Pourcentage configurable de la zone de valeur
- Lignes cibles ou ticks par ligne
- Profils indépendants multiples
- Contrôles sur le graphique
- Étiquettes de volume optionnelles et extensions POC / zone de valeur
- Affichage visuel personnalisable
- Calcul basé sur le volume tick
---
Le trading comporte des risques. Cet indicateur est un outil d'analyse technique et doit être utilisé conjointement avec une gestion appropriée des risques.
Résumé
Key features include three volume modes—Total, Up/Down, and Delta—that show different perspectives of volume activity. The indicator identifies the Point of Control (POC), the price level with the highest volume, and the Value Area, which covers a configurable percentage of total volume, with optional display of Value Area High (VAH) and Value Area Low (VAL) levels. Users can customize row layout, volume bar extensions, labels, colors, and on-chart controls for mode switching and display options.
Designed for swing, intraday, structure-based, and discretionary traders, this tool provides a contextual framework to understand where volume concentrated during specific moves, aiding in identifying key support and resistance levels based on volume distribution. Multiple independent profiles can be used simultaneously on the same chart.
Avis clients
5 | 100 % | |
4 | 0 % | |
3 | 0 % | |
2 | 0 % | |
1 | 0 % |
Discussion
Questions fréquentes
Plus de cet auteur























Prix