

Mô tả
Ý TƯỞNG
Một trung bình động bắt đầu từ một điểm giá được chọn thay vì ép mọi phân tích vào một khoảng thời gian cố định.
VẤN ĐỀ
Một trung bình động truyền thống được xác định bởi một khoảng thời gian.
20 cây nến. 50 cây nến. 200 cây nến.
Nhưng đôi khi câu hỏi quan trọng không phải là bạn muốn đo bao nhiêu cây nến.
Mà là đo lường nên bắt đầu từ đâu.
Một khoảng thời gian cố định nhìn ngược lại từ cây nến hiện tại, nhưng nó không biết sự kiện giá nào quan trọng với phân tích của bạn.
Nếu một đợt điều chỉnh bắt đầu ở đây, hoặc một đợt tăng bắt đầu ở đó, một MA 50 kỳ không thể được bảo rằng:
"Bắt đầu đo từ sự kiện này."
Khoảng thời gian xác định cửa sổ đo lường.
Nó không xác định nguồn gốc của nó.
KHÁI NIỆM CỐT LÕI: MỐI NỐI XÁC ĐỊNH NGUỒN GỐC. MA ĐO LƯỜNG TỪ ĐÓ.
Trung bình động có thể kéo được thay đổi điểm tham chiếu.
Trung bình động truyền thống lấy khoảng thời gian làm tham chiếu chính.
Trung bình động có thể kéo được lấy nguồn gốc làm tham chiếu chính.
Khoảng thời gian vẫn xác định cách tính toán hoạt động, trong khi tham số Max Period giới hạn cửa sổ tính toán lăn khi nó phát triển về phía trước từ mối nối.
Nhưng mối nối xác định nơi bắt đầu đo lường.
Điều này thay đổi câu hỏi từ:
"Tôi nên dùng khoảng thời gian MA nào?"
thành:
"Sự kiện giá nào tôi muốn MA này đo từ đó?"
NÓ LÀM GÌ
Trung bình động có thể kéo được cho phép bạn tự định nghĩa nguồn gốc đó.
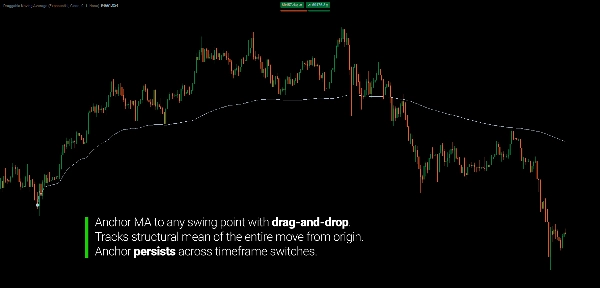
Đặt mối nối trên bất kỳ cây nến nào trong lịch sử giá, và trung bình động bắt đầu tính toán từ chính điểm đó về phía trước.
Kéo mối nối đến cây nến khác, và MA tính toán lại ngay lập tức.
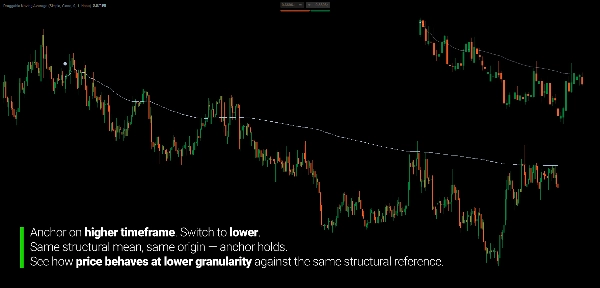
Chuyển đổi khung thời gian, và mối nối vẫn gắn với cùng một tham chiếu lịch sử trong khi phép tính thích ứng với dữ liệu có trên biểu đồ mới.
Tham chiếu là rõ ràng — không bị ẩn trong một khoảng thời gian.
CÁCH HOẠT ĐỘNG
Quy trình được thiết kế đơn giản:
1. Đặt mối nối.
Chọn bất kỳ cây nến nào quan trọng với phân tích của bạn.
2. MA bắt đầu từ đó.
Phép tính bắt đầu từ nguồn gốc bạn chọn và phát triển về phía trước.
3. Để giá phát triển.
Khi các cây nến mới xuất hiện, trung bình sẽ kết hợp dữ liệu giá đang phát triển.
4. Di chuyển mối nối khi tham chiếu của bạn thay đổi.
Kéo mối nối đến cây nến khác và toàn bộ phép tính cập nhật ngay lập tức.
Không cần phải liên tục thay đổi khoảng thời gian MA để gần đúng một điểm bắt đầu khác.
Hãy thay đổi chính tham chiếu.
MỘT TRUNG BÌNH ĐỘNG XÂY DỰNG XUNG QUANH DI CHUYỂN
Khi một MA được neo vào đầu một chuyển động giá cụ thể, phép tính phát triển từ nguồn gốc đó về phía trước.
Điều đó mang lại cho MA một bối cảnh khác với trung bình lăn thông thường.
Một đợt điều chỉnh có thể có MA neo riêng.
Một đợt tăng có thể có một cái khác.
Một dao động lớn có thể có một cái khác.
Bạn không còn yêu cầu MA mô tả một số lượng nến gần đây tùy ý.
Bạn đang yêu cầu nó đo một phần cụ thể của thị trường.
THEO DÕI CÁCH GIÁ PHÁT TRIỂN XUNG QUANH TRUNG BÌNH
MA neo có thể được sử dụng làm tham chiếu để quan sát cách giá hành xử trong quá trình chuyển động.
Giá có thể:
- Mở rộng ra xa trung bình trong quá trình chuyển động mạnh
- Quay trở lại trung bình trong quá trình tích lũy hoặc điều chỉnh
- Băng qua trung bình khi đặc tính của chuyển động thay đổi
- Quay lại trung bình sau một chuyển đổi hướng
Những hành vi này không được coi là tín hiệu giao dịch tự động.
Mục đích đơn giản hơn:
làm cho trung bình của một chuyển động giá xác định trở nên rõ ràng.
Ý nghĩa đến từ chuyển động bạn chọn để đo — không phải từ một con số MA cụ thể.
NĂM CÁCH TÍNH TRUNG BÌNH
Chọn phép tính phù hợp nhất với phân tích của bạn:
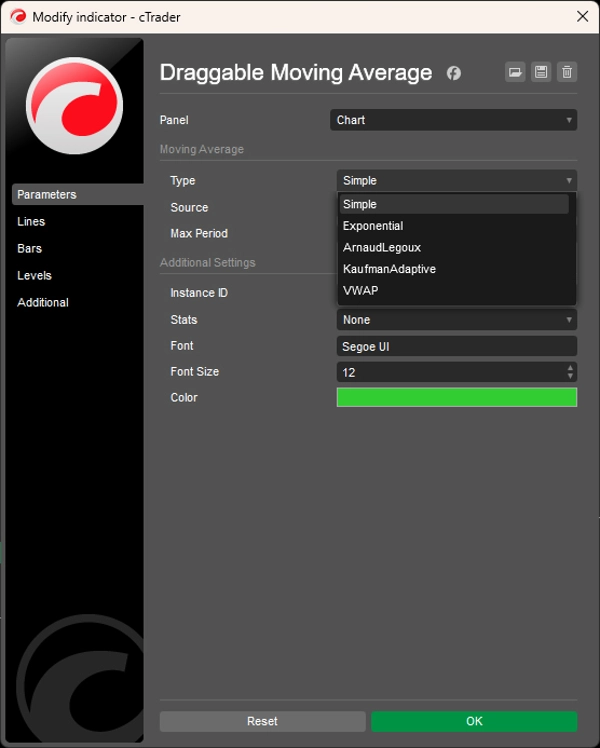
Đơn giản (SMA)
Một trung bình số học đơn giản phát triển từ mối nối.
Hàm mũ (EMA)
Ưu tiên trọng số lớn hơn cho dữ liệu giá gần đây hơn.
Arnaud Legoux (ALMA)
Một trung bình có trọng số được thiết kế để giảm độ trễ trong khi vẫn giữ được độ mượt mà.
Kaufman Adaptive (KAMA)
Điều chỉnh làm mượt theo hiệu quả thị trường.
VWAP
Đo giá trung bình có trọng số theo khối lượng từ nguồn gốc được chọn.
Tất cả các loại phép tính giữ nguyên ý tưởng cơ bản:
mối nối xác định nơi bắt đầu đo lường.
THAM CHIẾU VẪN GIỮ ĐƯỢC KHI ĐỔI KHUNG THỜI GIAN
Một trong những đặc tính hữu ích nhất của mối nối được xác định là tham chiếu không biến mất khi bạn thay đổi khung thời gian.
Neo điểm bắt đầu của một chuyển động trên biểu đồ hàng ngày.
Chuyển sang H1.
Rồi M15.
Mối nối vẫn gắn với cùng một điểm lịch sử trong khi MA tính toán lại sử dụng dữ liệu có trên khung thời gian mới.
Điều này làm cho nó hữu ích cho phân tích đa khung thời gian khi cùng một sự kiện giá cần giữ làm tham chiếu trên các độ phân giải biểu đồ khác nhau.
THỐNG KÊ TÙY CHỌN
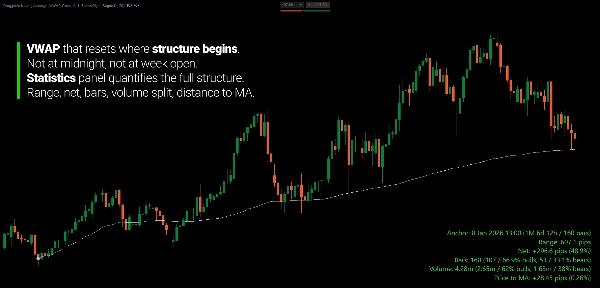
Bảng thống kê tùy chọn cung cấp cái nhìn định lượng về chuyển động giá giữa mối nối và cây nến hiện tại.
Nó có thể hiển thị:
- Khoảng cách tính bằng pip
- Thay đổi ròng tính bằng pip và phần trăm
- Số lượng và tỷ lệ phần trăm cây nến tăng / giảm
- Khối lượng tăng / giảm và tỷ lệ phần trăm
- Khoảng cách giá so với MA tính bằng pip và phần trăm
- Thời gian
- Số lượng cây nến kể từ mối nối
Bảng là tùy chọn.
Công cụ cốt lõi vẫn là trung bình động neo.
NHIỀU THAM CHIẾU
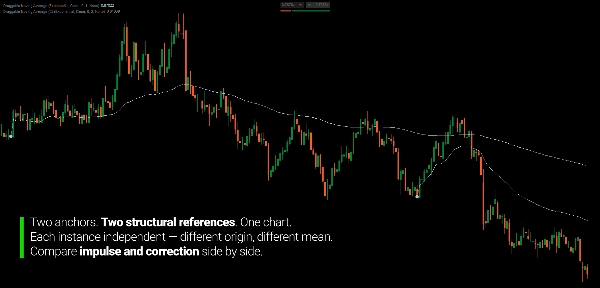
Nhiều phiên bản có thể được sử dụng đồng thời.
Một MA có thể được neo vào đầu một đợt điều chỉnh.
Một cái khác có thể được neo vào đợt tăng trước đó.
Mỗi phiên bản có danh tính riêng, cho phép các chuyển động giá khác nhau được đo độc lập trên cùng một biểu đồ.
XÂY DỰNG CHO VIỆC ĐO LƯỜNG, KHÔNG PHẢI THEO ĐUỔI TÍN HIỆU
Trung bình động có thể kéo được không cho bạn biết nên mua hay bán ở đâu.
Nó mang đến cho bạn điều cơ bản hơn:
cách xác định chính xác phần nào của thị trường bạn muốn trung bình động đo.
Dùng nó để nghiên cứu:
- Các đợt tăng và điều chỉnh
- Phát triển dao động
- Hành vi giá quanh một trung bình xác định
- Sự quay trở lại trung bình trong một chuyển động cụ thể
- Thay đổi đặc tính của một chuyển động
- Tham chiếu khung thời gian cao hơn từ biểu đồ khung thời gian thấp hơn
- Phân phối giá khác nhau từ các nguồn gốc khác nhau
Chỉ báo không quyết định điểm nào quan trọng.
Bạn chọn tham chiếu. MA đo những gì xảy ra từ đó.
TÍNH NĂNG CHÍNH
- Mối nối có thể kéo hoàn toàn
- Điểm bắt đầu do người dùng định nghĩa
- MA tính toán lại ngay lập tức khi mối nối di chuyển
- Mối nối tồn tại qua các thay đổi khung thời gian
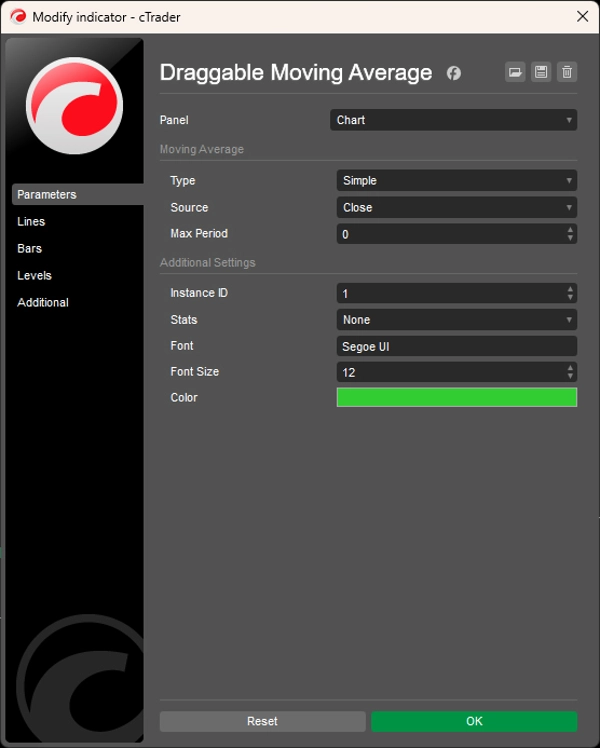
- Năm phương pháp MA: SMA, EMA, ALMA, KAMA, VWAP
- Tám nguồn giá có thể chọn
- Giới hạn Max Period với cửa sổ lăn từ nguồn gốc mối nối
- Bảng thống kê tùy chọn với bốn vị trí góc
- Nhiều phiên bản độc lập
- Thiết kế cho phân tích đa khung thời gian
---
Giao dịch có rủi ro. Chỉ báo này là công cụ phân tích kỹ thuật và nên được sử dụng cùng với quản lý rủi ro phù hợp.
Tóm tắt
This approach transforms the MA into a structural mean that reflects the average price evolution from a defined origin, aiding in mean reversion and reversal detection. Price behavior around this anchored MA provides insights into momentum, consolidation, and potential trend exhaustion.
The indicator supports five MA calculation methods—Simple (SMA), Exponential (EMA), Arnaud Legoux (ALMA), Kaufman Adaptive (KAMA), and Volume Weighted Average Price (VWAP)—with a configurable maximum period to cap the lookback window. It offers eight price source options and an optional statistics panel displaying real-time metrics such as range, net change, volume splits, and price distance from the MA.
Multiple instances can run simultaneously, each with a unique ID, allowing concurrent analysis of different structural moves without conflicts. This tool is designed for swing and position traders, multi-timeframe analysts, and discretionary traders who require precise, structure-based MA anchoring rather than arbitrary period-based averages.
Đánh giá của khách hàng
Thảo luận
Câu hỏi thường gặp






















Giá
