VIX - volatility indicator - Renko
Индикатор
Версия 1.0, Feb 2025
Windows, Mac
Описание
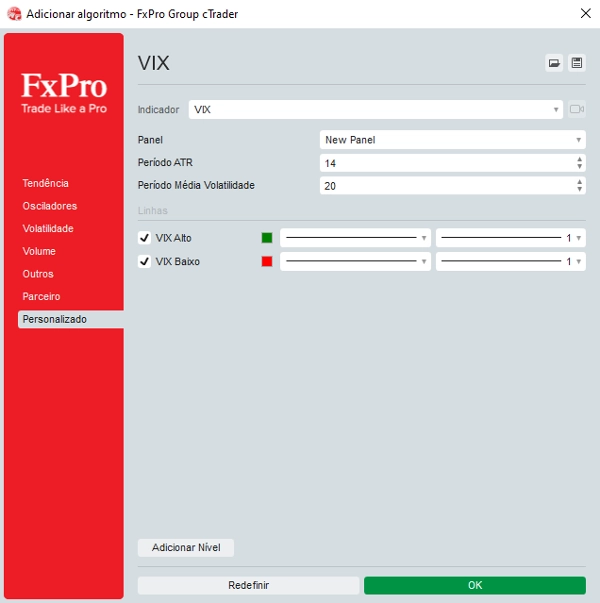
Настройте параметры: введите желаемые значения для уровней LowLevel и HighLevel и отрегулируйте коэффициент масштабирования VIX, чтобы линия VIX имела нужную высоту.
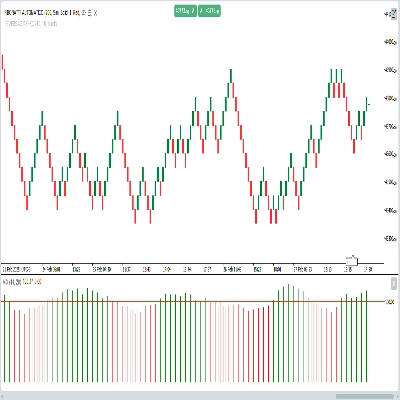
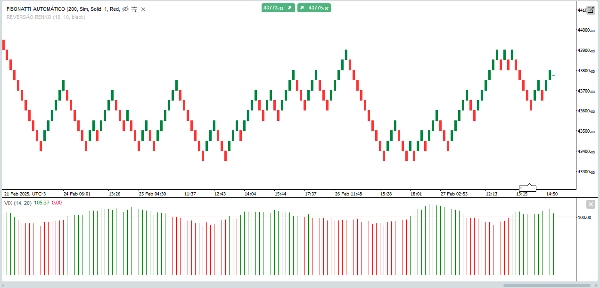
Посмотрите на график:
Когда VIX превышает HighLevel и объем высок (зеленые свечи), можно считать, что произошел пробой.
Когда VIX ниже LowLevel, это может указывать на период низкой волатильности.
Сводка
Профиль индикатора
Отзывы покупателей
0.0
Отзывы: 0
Отзывы покупателей
У этого продукта еще нет отзывов. Уже попробовали его? Поделитесь впечатлениями!
Обсуждение
Частые вопросы
Breakout
Продукты, доступные в cTrader Store, включая торговых ботов, индикаторы и плагины, предоставляются сторонними разработчиками и доступны исключительно в информационных и технических целях. cTrader Store не является брокером и не предоставляет инвестиционные консультации, персональные рекомендации или какие-либо гарантии будущей доходности.


![Логотип продукта "[Stellar Strategies] MARSI Signal Plotter"](https://cdn.ctrader.com/image/webp/7b2b8da6-8f8e-4646-8d4a-4710c516c01e_25567)


Цена
С 05/02/2025
30
Продажи