ACTO-v1
Indicatore
Versione 1.0, Mar 2025
Windows, Mac
4.5
Recensioni: 2
Descrizione
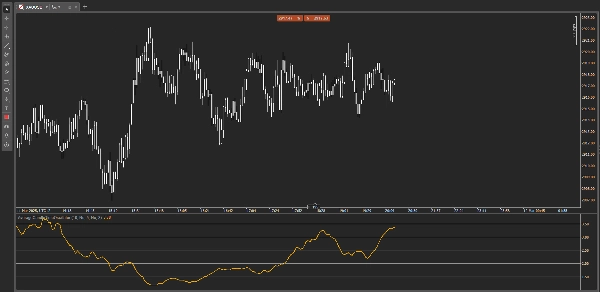
Oscillatore del Tempo Medio della Candela (ACTO)
Migliora le tue prestazioni di trading con ACTO, l'oscillatore avanzato che analizza la durata media delle candele del grafico, permettendoti di identificare rapidamente la volatilità e i cambiamenti nell'attività di mercato.
Perché scegliere ACTO?
- Misurazione Accurata del Tempo della Candela: Rileva facilmente condizioni di mercato lente o rapide per ottimizzare i tuoi ingressi e uscite.
- Soglia Personalizzabile: Imposta soglie specifiche per evidenziare momenti critici e reagire prontamente ai cambiamenti del ritmo di mercato.
- Avvisi Automatici: Ricevi notifiche immediate quando la durata media della candela supera la soglia impostata, assicurandoti di non perdere mai importanti opportunità di trading.
- Interfaccia Intuitiva: Visualizzazione semplice e intuitiva, adatta a trader di tutti i livelli di esperienza.
Perfetto per scalping, day trading e trading su timeframe a breve termine, ACTO è uno strumento essenziale per ogni trader che desidera anticipare movimenti significativi del mercato basandosi sulle dinamiche temporali del mercato.
Altri indicatori
Riepilogo
Profilo indicatore
Recensioni dei clienti
4.5
Recensioni: 2
5 | 50 % | |
4 | 50 % | |
3 | 0 % | |
2 | 0 % | |
1 | 0 % |
Recensioni dei clienti
March 19, 2025
The product earns time when it gives the trader a reason to pause. Demo first makes more sense.
March 15, 2025
Bad impulses show up less often in the notes, but the market context still matters.
Discussioni
Domande frequenti
Scalping
I prodotti disponibili tramite cTrader Store, inclusi bot di trading, indicatori e plugin, sono forniti da sviluppatori terzi e resi disponibili esclusivamente a scopo informativo e di accesso tecnico. cTrader Store non è un broker e non fornisce consulenze in materia di investimento, raccomandazioni individualizzate o garanzie di risultati futuri.
Altro da questo autore


Prezzo
378.94M
Volume negoziato
1.9M
Profitto in pip