
Açıklama
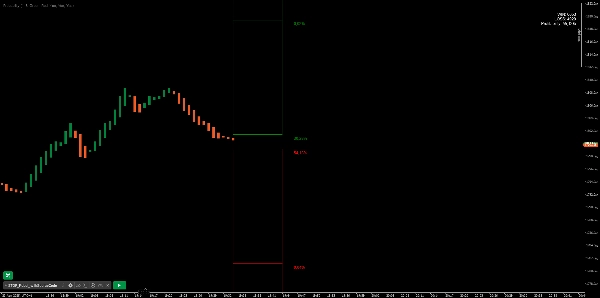
Breakout Olasılığı yeni bir yüksek veya düşük olasılığını hesaplayan ve bunu yüzde olarak bir seviye şeklinde gösteren değerli bir göstergedir. Yeni yüksek ve düşük olasılığı geriye dönük test edilmiştir ve sonuçlar bir tabloda gösterilmiştir—bir sonraki mumun yeni bir yüksek veya düşük olma olasılığını anlamanın basit bir yolu. Ayrıca, gösterge mumun üzerinde ve altında bu seviyelere ulaşma olasılığı ile birlikte dört ek seviye daha gösterir.
Gösterge, tüccarların bir sonraki mumun yönünün olasılığını anlamalarına yardımcı olur, bu da ticaret eğiliminizi belirlemek için kullanılabilir.
█ Hesaplamalar
Algoritma, önceki mumun kırmızı mı yoksa yeşil mi olduğuna bağlı olarak tüm yeşil ve kırmızı mumları ayrı ayrı hesaplar ve bir veya daha fazla çizgiye ulaşıldığında puanlar verir. Daha sonra algoritma, tarihte kaç mumun bu seviyelere ulaştığını hesaplar ve bunu her çizgide yüzde değeri olarak gösterir.
█ Örnek
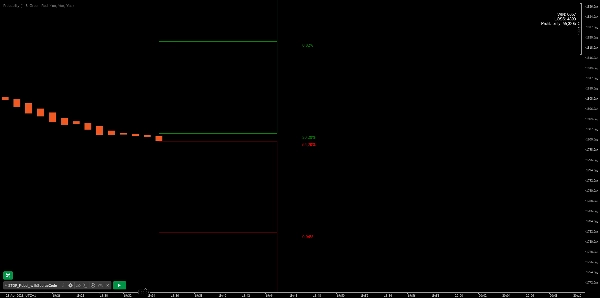
Bu örnekte, önceki mum yeşildi; yeni bir yüksek seviyenin %72,82 oranında ve düşük seviyenin ise sadece %28,29 oranında gerçekleştiğini görebiliyoruz. Bu durumda yeni bir yüksek seviye oluşmuştur.
Özet
Müşteri değerlendirmeleri
5 | 100 % | |
4 | 0 % | |
3 | 0 % | |
2 | 0 % | |
1 | 0 % |


